



Do you want to trade USD/RUB? How about trading USD/PLN instead?
USD/PLN has a high correlation with USD/RUB on the daily timeframe.
Share this:

Almost one year ago, Russia senselessly invaded Ukraine. At the time USD/RUB was trading near 85.9493. In the days following the invasion, the pair spiked to a high of 154.25. Over the following month, the pair retraced the entire move as many banks suspended trading of the Ruble and froze Russian assets. Russia hiked interest rates to 20%, leading to a stronger Ruble. In addition, capital controls were put into place to prevent foreign currencies from leaving the country. The value of the Ruble was essentially now a state-controlled currency. The value of USD/RUB fell to a low of 50.65 on June 29th, 2022, and had been trading near 60 throughout the remained of 2022. As a result, nearby counties whose currency value fluctuated with the Ruble became decoupled.
Fast forward a year. The Ruble is still under government control and many countries won’t deal with Russian banks. However, Russia has cut its interest rates to 7.5%, which is lower than some of its Eastern European neighbors. The value of USD/RUB has begun to increase and is currently closing on pre-invasion levels. The pair reached a high of 75.10 on Thursday.

Source: Tradingview, Stone X
There is one currency pair that has become correlated once again with the USD/RUB. In the bottom panel of the chart below, the correlation coefficient between USD/PLN and USD/RUB rose to 0.92 over the last week. USD/PLN had originally traded higher with USD/RUB as Russia invaded Ukraine. However, as USD/RUB moved to new lows, USD/PLN stalled and began moving higher in an orderly upward sloping channel. The pair made a high on September 29th at 5.0601. Since then, the USD/PLN moved lower, retracing to the 78.6% Fibonacci level of the move since the beginning of the war to the September 29th highs at 4.2666. As long as the correlation coefficient between USD/RUB and USD/PLN remains above +0.80, the correlation is considered strong, and the two currency pairs should move in the same direction.

Source: Tradingview, Stone X
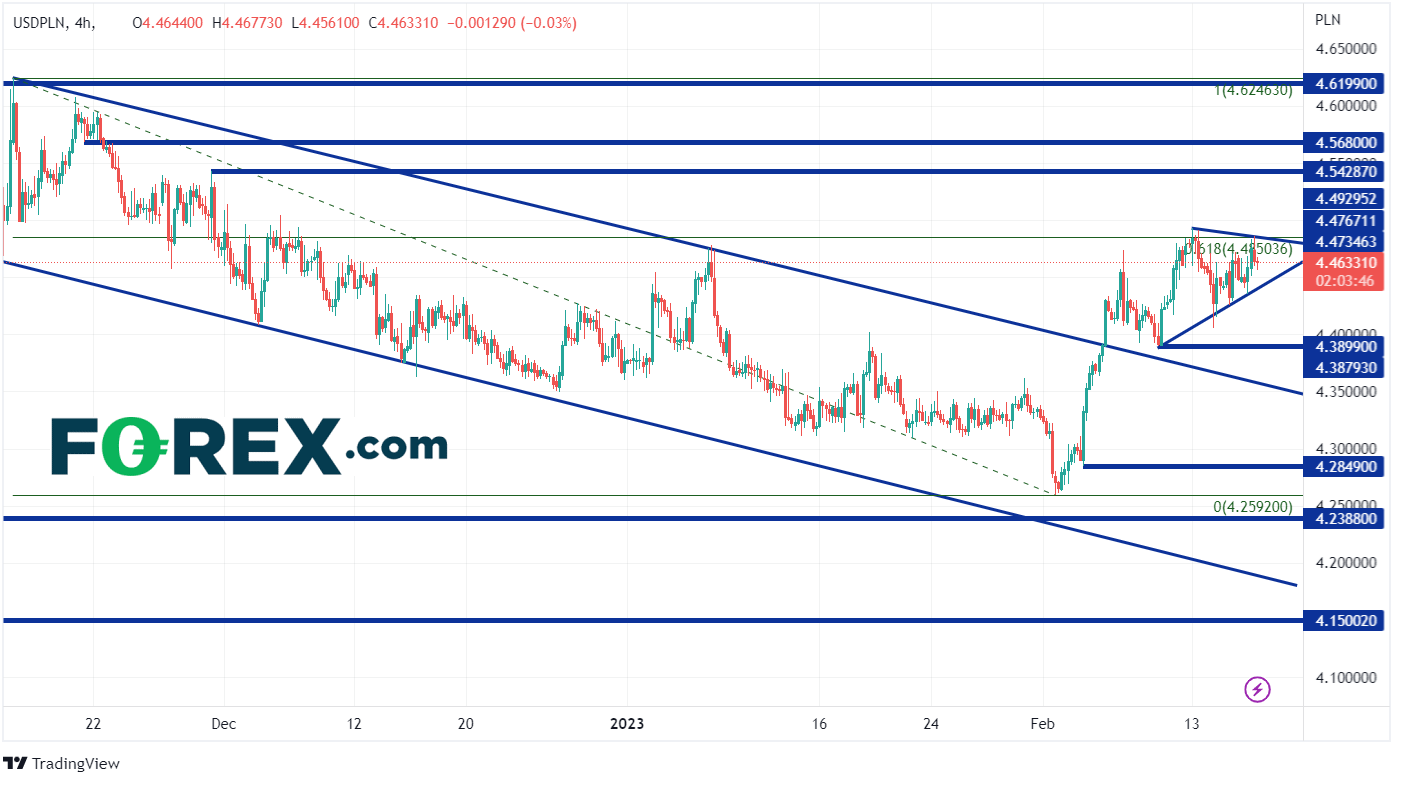
On a 240-minute timeframe, USD/PLN is trading in a symmetrical triangle. If price breaks higher out of the triangle, first resistance is at the highs from November 30th, 2022 at 4.5429. Above there, price can move to the 200-Day Moving Average at 4.5660 (see daily), then addition resistance from November 21st, 2022, at 4.5680. However, if USD/PLN moves lower from the triangle, first support is at a confluence near the lows from February 9th and the 50-Day Moving Average between 4.3823 and 4.3902. Below there, price can fall to the top trendline of the recent channel near 4.3607, then the spike low on February 3rd at 4.2849.
Source: Tradingview, Stone X
Do you want to trade USD/RUB but you can’t? USD/PLN has a high correlation with USD/RUB on the daily timeframe. Therefore, if USD/PLN moves in one direction, USD/RUB should move in the same direction, as long as the correlation remains above +0.80. Therefore, USD/PLN may be a good substitute.
Almost one year ago, Russia senselessly invaded Ukraine. At the time USD/RUB was trading near 85.9493. In the days following the invasion, the pair spiked to a high of 154.25. Over the following month, the pair retraced the entire move as many banks suspended trading of the Ruble and froze Russian assets. Russia hiked interest rates to 20%, leading to a stronger Ruble. In addition, capital controls were put into place to prevent foreign currencies from leaving the country. The value of the Ruble was essentially now a state-controlled currency. The value of USD/RUB fell to a low of 50.65 on June 29th, 2022, and had been trading near 60 throughout the remained of 2022. As a result, nearby counties whose currency value fluctuated with the Ruble became decoupled.
Fast forward a year. The Ruble is still under government control and many countries won’t deal with Russian banks. However, Russia has cut its interest rates to 7.5%, which is lower than some of its Eastern European neighbors. The value of USD/RUB has begun to increase and is currently closing on pre-invasion levels. The pair reached a high of 75.10 on Thursday.

Source: Tradingview, Stone X
There is one currency pair that has become correlated once again with the USD/RUB. In the bottom panel of the chart below, the correlation coefficient between USD/PLN and USD/RUB rose to 0.92 over the last week. USD/PLN had originally traded higher with USD/RUB as Russia invaded Ukraine. However, as USD/RUB moved to new lows, USD/PLN stalled and began moving higher in an orderly upward sloping channel. The pair made a high on September 29th at 5.0601. Since then, the USD/PLN moved lower, retracing to the 78.6% Fibonacci level of the move since the beginning of the war to the September 29th highs at 4.2666. As long as the correlation coefficient between USD/RUB and USD/PLN remains above +0.80, the correlation is considered strong, and the two currency pairs should move in the same direction.

Source: Tradingview, Stone X
Trade USD/PLN now: Login or Open a new account!
• Open an account in the UK
• Open an account in Australia
• Open an account in Singapore
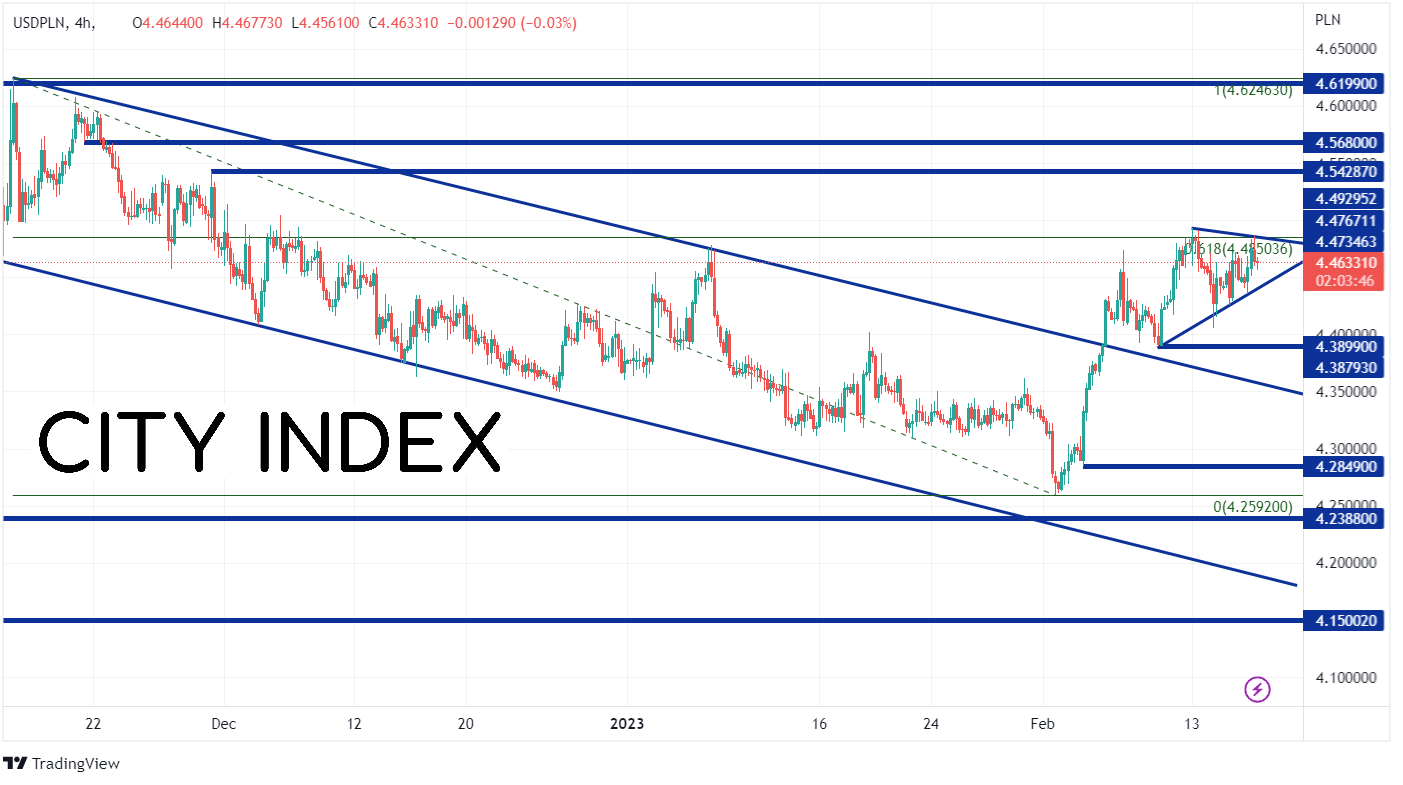
On a 240-minute timeframe, USD/PLN is trading in a symmetrical triangle. If price breaks higher out of the triangle, first resistance is at the highs from November 30th, 2022 at 4.5429. Above there, price can move to the 200-Day Moving Average at 4.5660 (see daily), then addition resistance from November 21st, 2022, at 4.5680. However, if USD/PLN moves lower from the triangle, first support is at a confluence near the lows from February 9th and the 50-Day Moving Average between 4.3823 and 4.3902. Below there, price can fall to the top trendline of the recent channel near 4.3607, then the spike low on February 3rd at 4.2849.
Source: Tradingview, Stone X
Do you want to trade USD/RUB but you can’t? USD/PLN has a high correlation with USD/RUB on the daily timeframe. Therefore, if USD/PLN moves in one direction, USD/RUB should move in the same direction, as long as the correlation remains above +0.80. Therefore, USD/PLN may be a good substitute.
Learn more about forex trading opportunities.
Related tags:
Latest market news




The complete CFD trading experience
Award-winning platforms, competitive spreads, low commissions and dedicated support.
We live and breathe the markets and are dedicated to helping traders realise their ambitions as we continue to set the industry bar.
Economic calendar
Web Trader platform
Our sophisticated web-based platform is packed with features.
Related articles
EUR/USD Forecast: Euro Struggles to Find Support Even After U.S. PCE Data
The euro continues to face a challenging environment in the short term. The currency has struggled to regain ground against a U.S. dollar that remains firmly supported, a dynamic reflected in EUR/USD, which has now recorded three consecutive losing sessions and a decline of roughly 0.6%.
Canadian Dollar Forecast: USD/CAD Four-Week Rally Eyes Yearly Highs 9 30 2026
USD/CAD has advanced in 14 of the past 15 sessions, but stretched momentum raises the stakes as major resistance and NFP come into focus.


British Pound Technical Outlook: GBP/USD Rebound Challenges September Downtrend 9 30 2026
Sterling has rallied sharply from key support, with GBP/USD at an inflection point that could determine whether a larger recovery is underway.
StoneX Europe Ltd may make third party material available on this website which may contain information included but not limited to the conditions of financial markets. The material is for information purposes only and does not contain, and should not be construed as containing, investment advice and/or investment recommendation and/or an investment research and/or an offer of or solicitation for any transactions in financial instruments; any decision to enter into a specific transaction shall be made by the client following an assessment by him/her of their situation.
StoneX Europe Ltd makes no representation or warranty and assumes no liability as to the accuracy or completeness of the information provided, nor any loss arising from any investment based on a recommendation, forecast or other information supplied. You should always seek independent advice as to your suitability to speculate in any related markets and your ability to assume the associated risks, if you are at all unsure. We are not under any obligation to update any such material. Any opinion made may be personal to the author and may not reflect the opinion of StoneX Europe Ltd.