



EUR/USD Sell-Off Snaps Back, What’s the True Trend?
EUR/USD was mired in an aggressive continuation of the sell-off after CPI yesterday, but a strong rally from the lows illustrates a stretched marked showing elements of exhaustion.
Share this:

EUR/USD Talking Points:
- This was front-and-center on the Tuesday webinar as both the USD and EUR/USD moves were already showing signs of being stretched to extremes.
- The CPI report yesterday was pretty much what USD bulls would want, as higher inflation brought stronger odds of more rate hikes from the Fed.
- And while this initially pushed both USD strength and EUR/USD weakness, both markets pared back quickly, and at this point, the weekly EUR/USD chart is showing an indecisive doji with a little more than a day to go until it closes.
Timing tops and bottoms can be a painful endeavor. Just when you think prices can’t slide any lower, another punch arrives, and that’s precisely what happens. This isn’t to say that turns can’t be traded or sought after in a trading strategy. But it does require a good deal of humility as, by nature, the trader is going against the grain, and expecting a flip of the status quo.
I talked about this at-length in the webinar on Tuesday, as there’s two different ways that turns can show up. The first, and perhaps the most interesting from a strategy standpoint, is through capitulation. This is when trend riders have an open door to go for continuation of the move but, instead, they pullback and expose an underside wick. This shows exhaustion with an exclamation point. The other mechanism is a slowing of the trend as buyers or sellers get increasingly disinterested, and this is what can form falling or rising wedges, as fresh highs or lows do show, it’s just a weak form of trend extension that, eventually, can pan out to a reversal.
As we go into the end of the week there’s a number of markets showing these symptoms. Gold is especially high on that list as yesterday’s CPI was ostensibly something that could have or maybe even should have delivered a knock out punch, giving sellers fresh lows and a run down to test the $4k psychological level.
But perhaps more important for the FX world is what’s been happening in EUR/USD and, in-turn, the USD.
The Euro has been mired in a strong sell-off and this as seen EUR/USD go to its most oversold levels on the daily chart in a decade. On Tuesday, there was a building case of disinterest but yesterday another one of those possible knock out punches arrived in the form of a hot CPI report.
And while Euro sellers initially pushed down to a fresh yearly low on the back of that release, it’s what’s happened after that’s more important, and that’s sellers pulling back and buyers coming in to set a fresh higher-high on the pair.
EUR/USD Four-Hour Chart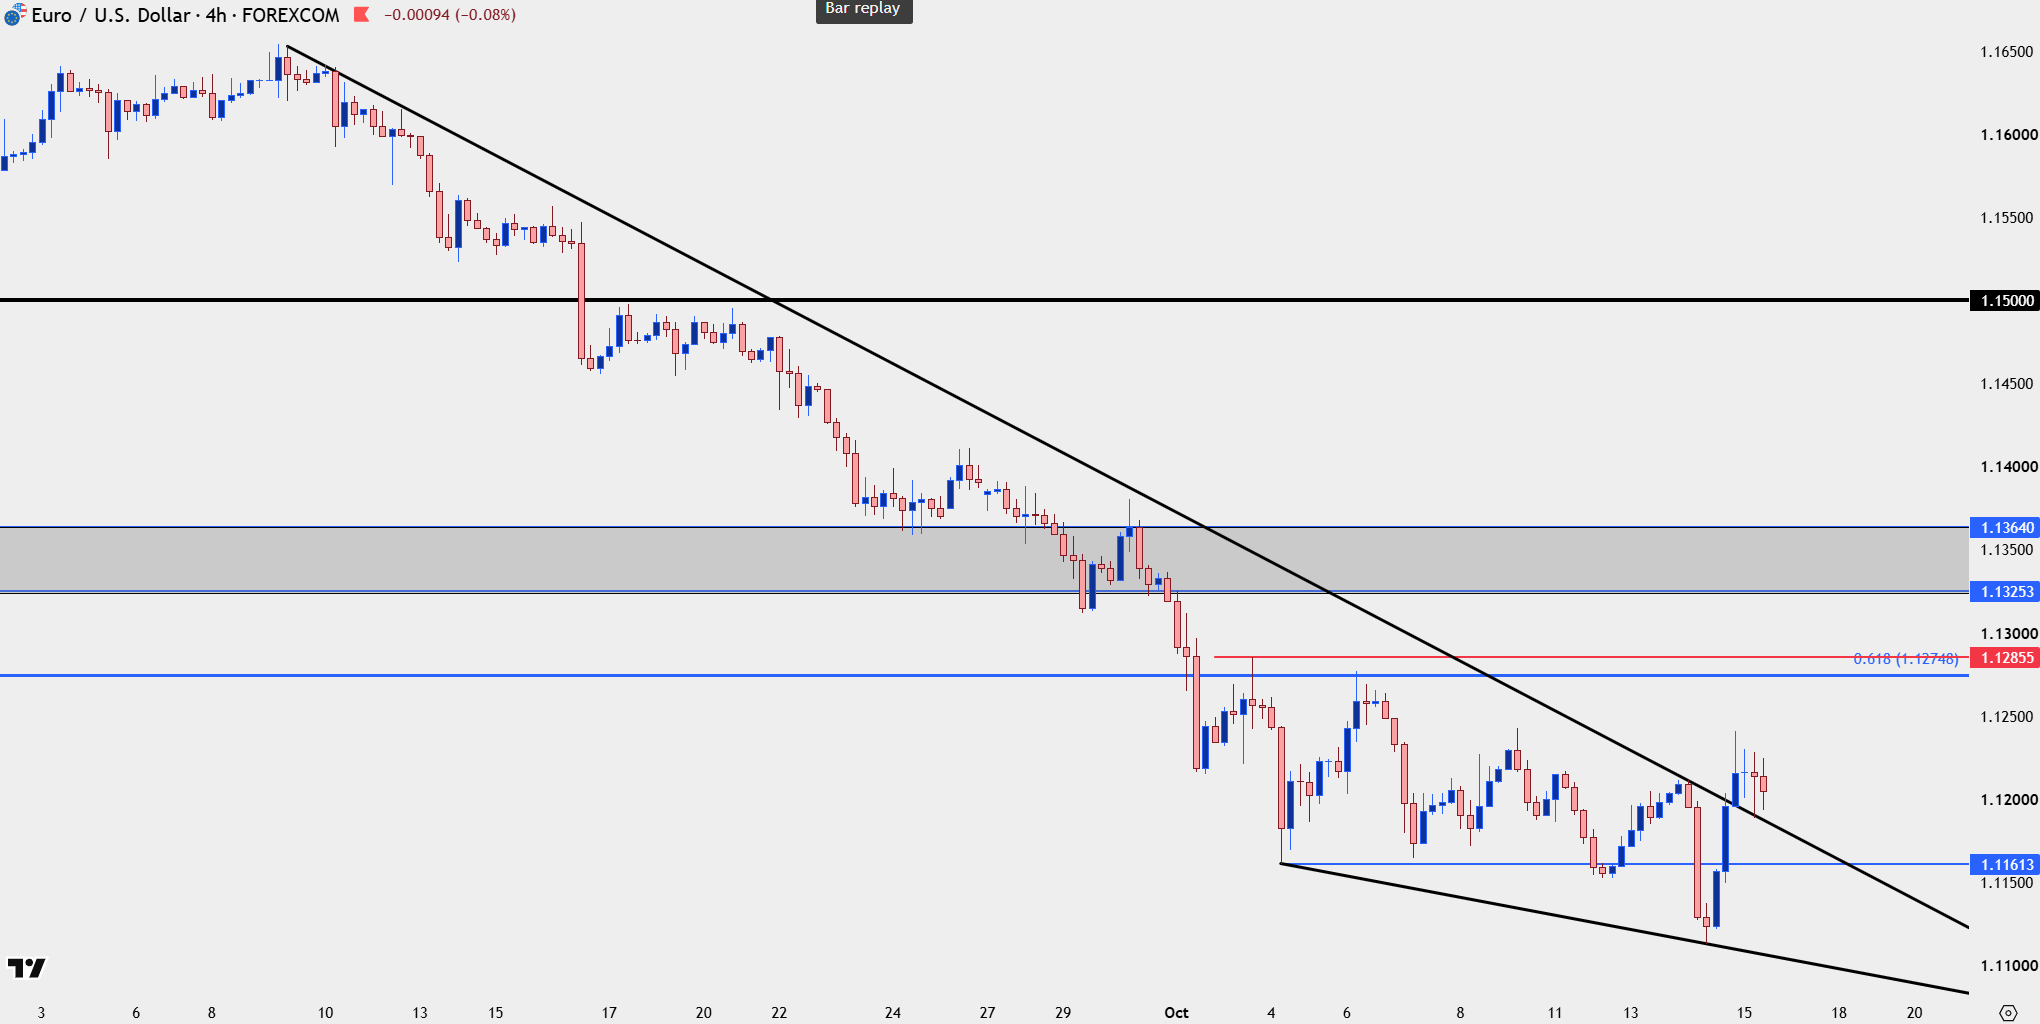
Chart prepared by James Stanley; data derived from Tradingview
EUR/USD Big Picture
At the core of the push is fear around the Eurozone, and it’d be remiss to not consider leadership at the ECB as a part of that fear. While Mario Draghi had previously kept the single currency together with pledges of doing ‘whatever it takes’ to keep the union intact, current ECB leadership has seemed less interested in addressing flying French bond yields. And perhaps by mere coincidence, current ECB President Christine Lagarde has been rumored to have designs towards other posts, most currently, at the World Economic Forum. And this seems to be at least somewhat involved with a bid in the Euro as the currency has recently begun to show signs of stabilization.
From the weekly chart, price is showing as a doji and this comes after a streak of red weekly bars. As you can see from numerous prior examples on the weekly chart, extended wicks, and shows of indecision, can often populate around turns. This, of course, doesn’t mean that price has to go up, but the behavior change, especially in light of data that seemingly goes against that grain, is of interest considering for how long the sell-off has held.
EUR/USD Weekly Chart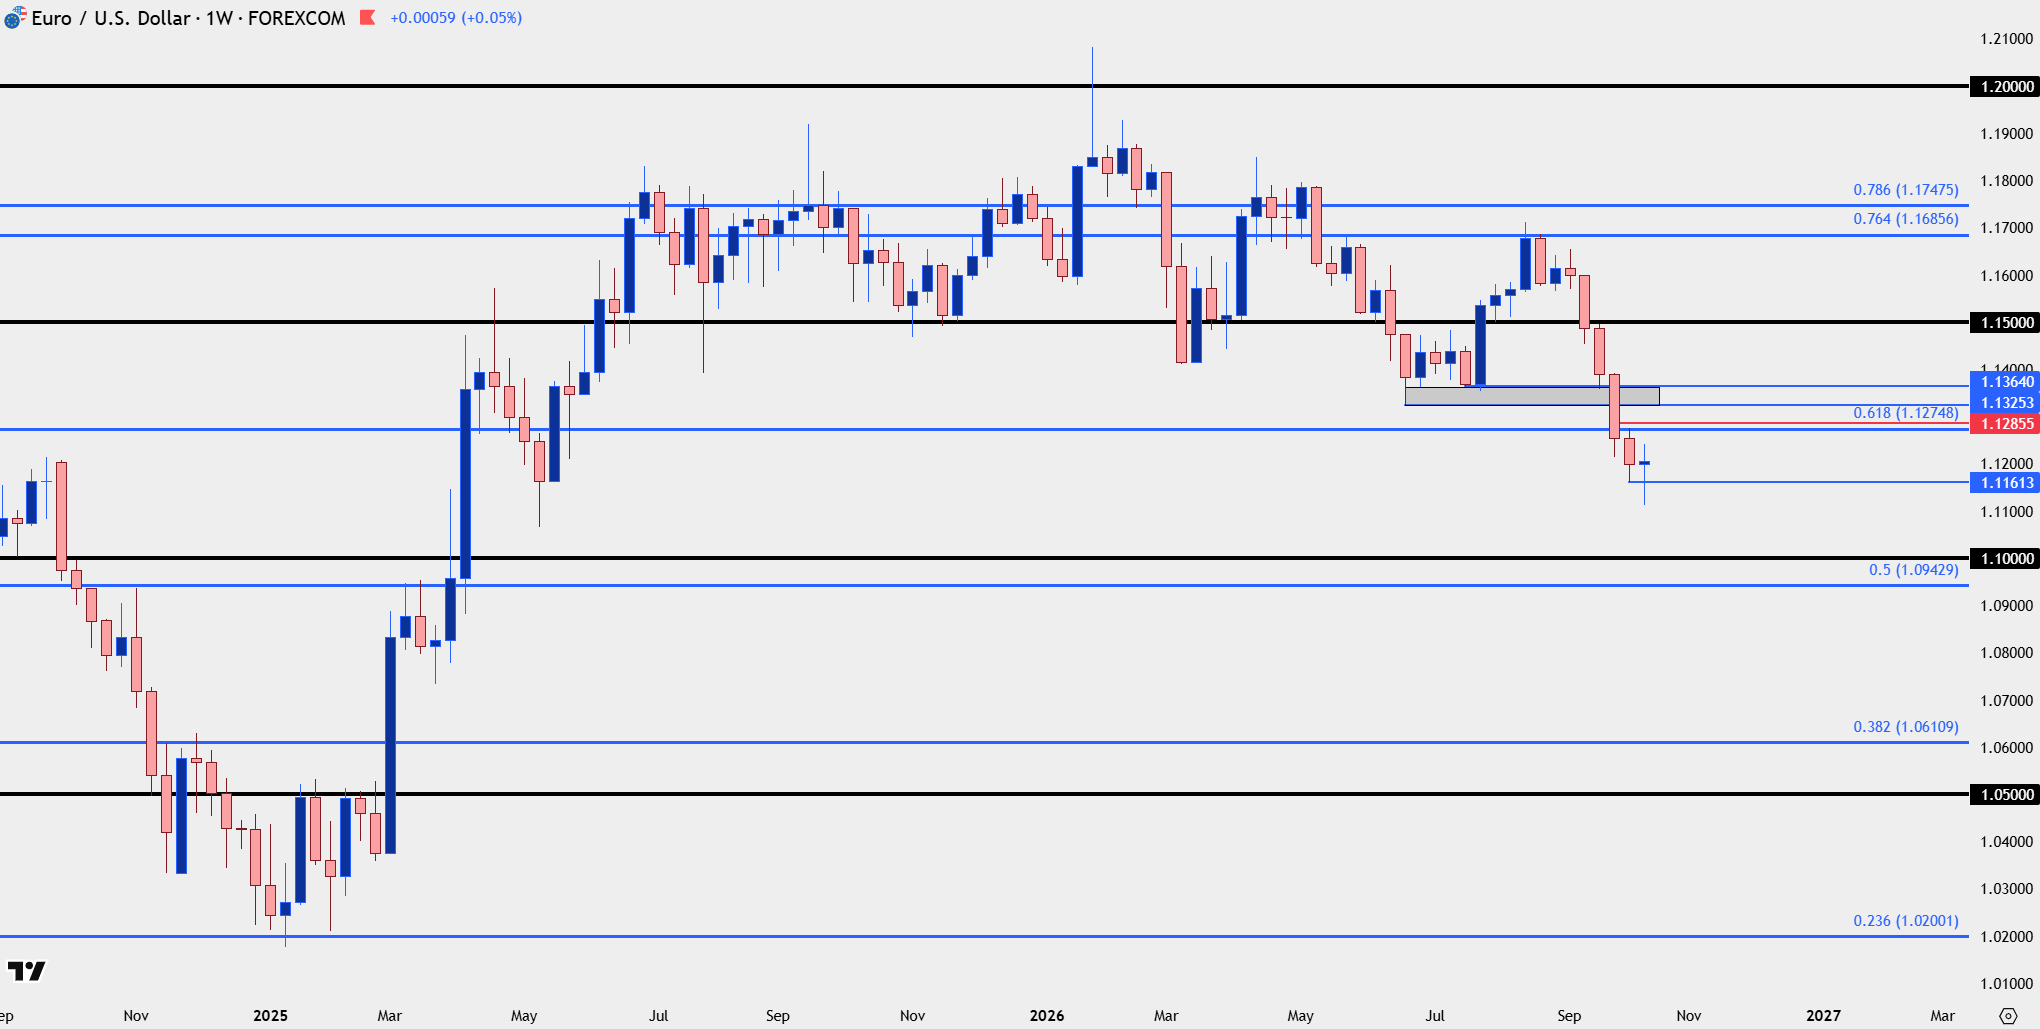
Chart prepared by James Stanley; data derived from Tradingview
EUR/USD Daily
It’s the daily chart that I think is most interesting at this point. Each day for this week it’s the 1.1153 level that’s helped to set support, with the Wednesday candle jutting below after the CPI-fueled sell-off. That extended underside wick illustrates capitulation, which adds perspective to the falling wedge shown in the first chart in this article.
It’s too early for celebration for bulls, however, as the upper wick showing on the current daily candle, helped along by a strong PPI report earlier on the day, shows that buyers weren’t exactly able to hold the move, not yet, at least. But – this does provide some important context as it’s that zone from 1.1275-1.1285 where bulls would have made a more convincing push of the trend. And, shorter-term, it’s the 1.1200 level that stands out as possible support as that counters the 1.1153 level for each of the daily candles so far this week.
EUR/USD Daily Chart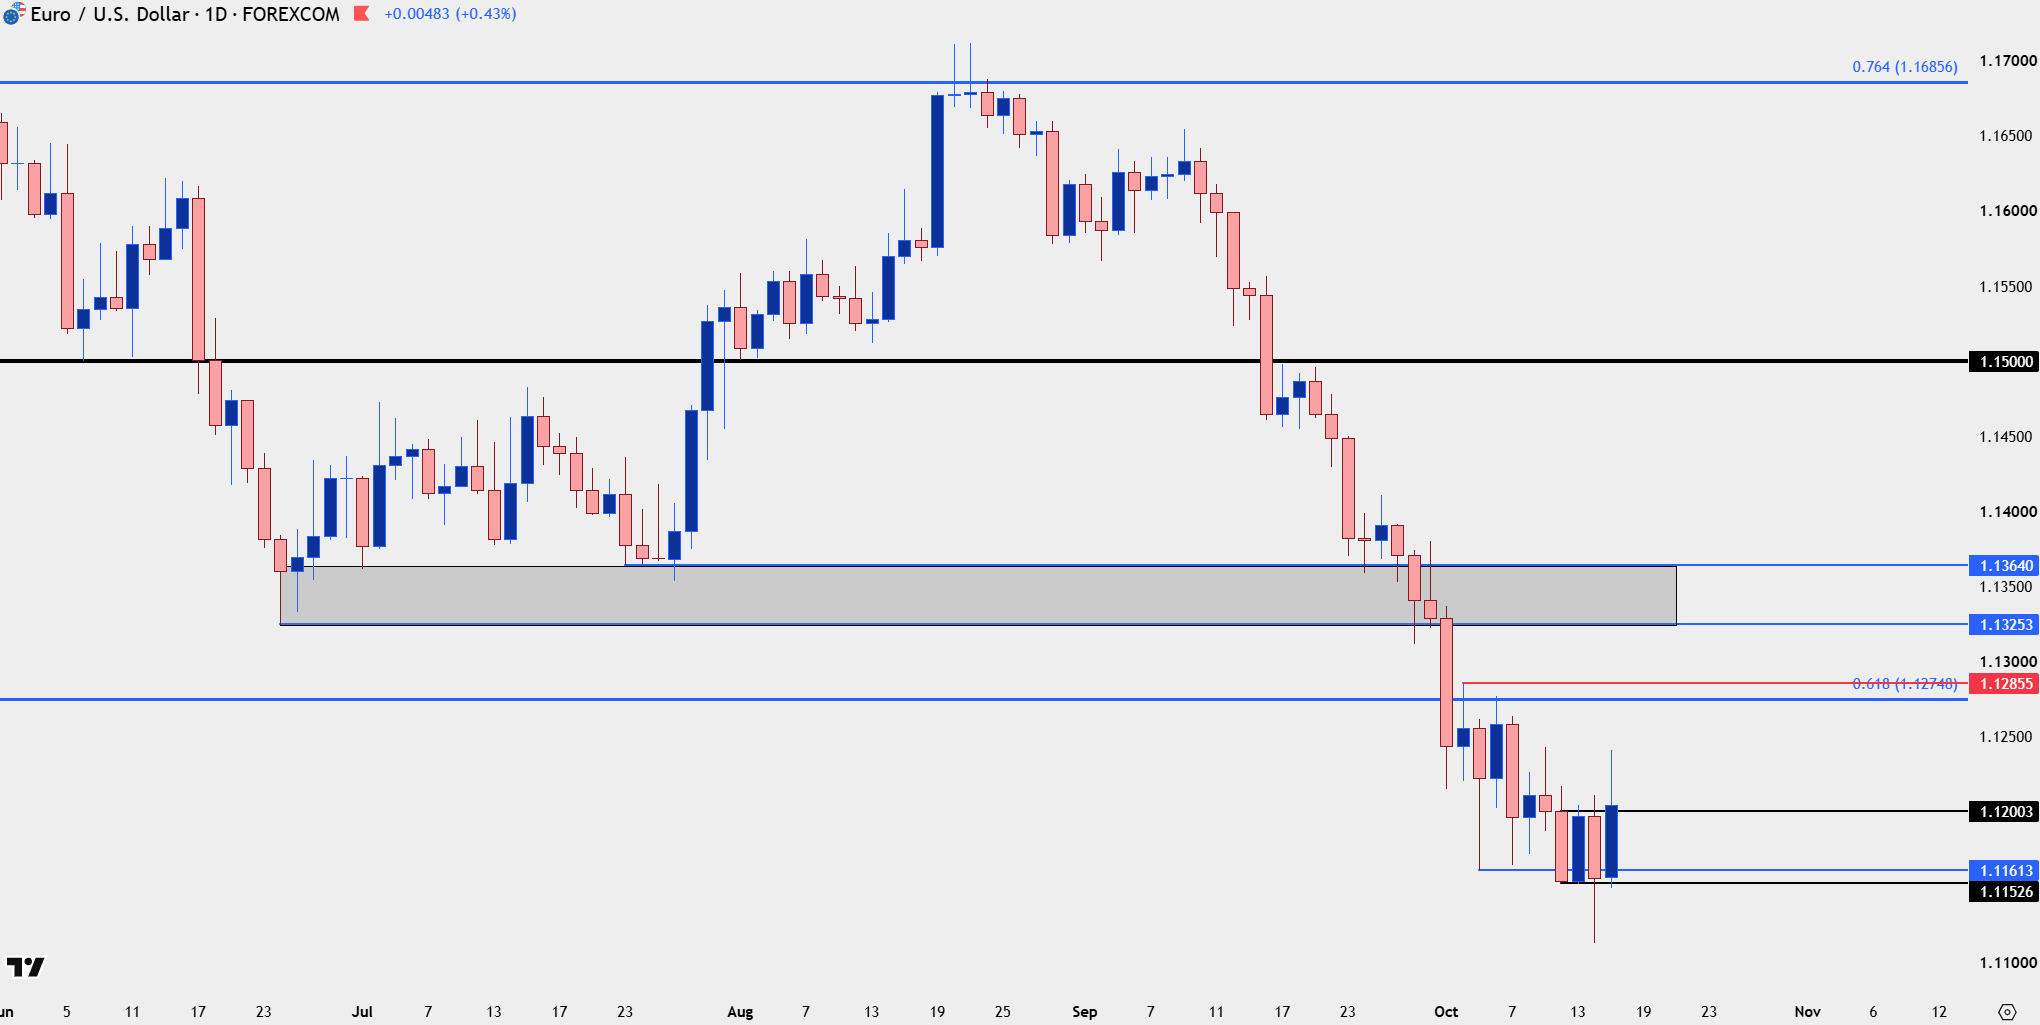
Chart prepared by James Stanley; data derived from Tradingview
--- written by James Stanley, Senior Market Analyst, Global Macro
Related tags:



The complete CFD trading experience
Award-winning platforms, competitive spreads, low commissions and dedicated support.
We live and breathe the markets and are dedicated to helping traders realise their ambitions as we continue to set the industry bar.
Economic calendar
Web Trader platform
Our sophisticated web-based platform is packed with features.
Related articles

EUR/USD Sell-Off Snaps Back, What’s the True Trend?
EUR/USD was mired in an aggressive continuation of the sell-off after CPI yesterday, but a strong rally from the lows illustrates a stretched marked showing elements of exhaustion.

Gold Hammered After CPI, Tests Below $4100
Gold prices came into the day with a bullish backdrop but that has dimmed after the CPI release earlier on the day.

EUR/USD Analysis: Euro Loses Ground After a Stronger-Than-Expected U.S. CPI Report
The trading week continues to unfold and weakness around the euro has once again become increasingly evident in the short term. This can be seen in the recent performance of EUR/USD, which has declined roughly 0.3% over the last three trading sessions, highlighting renewed strength in the U.S. dollar.
StoneX Europe Ltd may make third party material available on this website which may contain information included but not limited to the conditions of financial markets. The material is for information purposes only and does not contain, and should not be construed as containing, investment advice and/or investment recommendation and/or an investment research and/or an offer of or solicitation for any transactions in financial instruments; any decision to enter into a specific transaction shall be made by the client following an assessment by him/her of their situation.
StoneX Europe Ltd makes no representation or warranty and assumes no liability as to the accuracy or completeness of the information provided, nor any loss arising from any investment based on a recommendation, forecast or other information supplied. You should always seek independent advice as to your suitability to speculate in any related markets and your ability to assume the associated risks, if you are at all unsure. We are not under any obligation to update any such material. Any opinion made may be personal to the author and may not reflect the opinion of StoneX Europe Ltd.