





Euro Forecast: EUR/USD 1st Green Week in 7, but Can Support Hold?
EUR/USD has been in a bearish state since the Q4 open, and it was six consecutive red weeks until last week.
Share this:

Euro, EUR/USD Talking Points:
- EUR/USD posted its first green weekly bar since late-November, making the first green weekly candle in seven weeks.
- The pair ran into a major support level on Monday at the 1.0200 handle, which led to a dragonfly doji. And while sellers did continue to push, the rest of the week saw higher-lows each day through Friday.
- EUR/GBP put in a major reaction at a big level and EUR/JPY tested a breakdown: Both pairs are looked at below.
- I look at all three Euro pairs in the weekly webinar on Tuesday, and you’re welcome to join: Click here for registration information.
EUR/USD Finally Finds a Bounce
It’s been tough sledding for Euro bulls since the Q4 open last year and that’s particularly been the case over the past six weeks as there hasn’t been a green weekly bar since the late-November candle. That push lasted through early-December, until the 1.0611 Fibonacci level came into play to mark the high on the day of NFP that month. That then led to a decisive continuation in the sell-off, all the way through this week’s open when a major level came into play on Monday for EUR/USD.
The 1.0200 level is a key Fibonacci level, as this is the 23.6% retracement from the 2021-2022 major move. And from that same major move, the 61.8% retracement caught the high in 2023, and the 38.2% marker set the low for the first-half of last year. That same price then came back to mark resistance in December before sellers went on the attack and that push finally amounted to a test of the 23.6% marker earlier in the week.
EUR/USD Weekly Price Chart
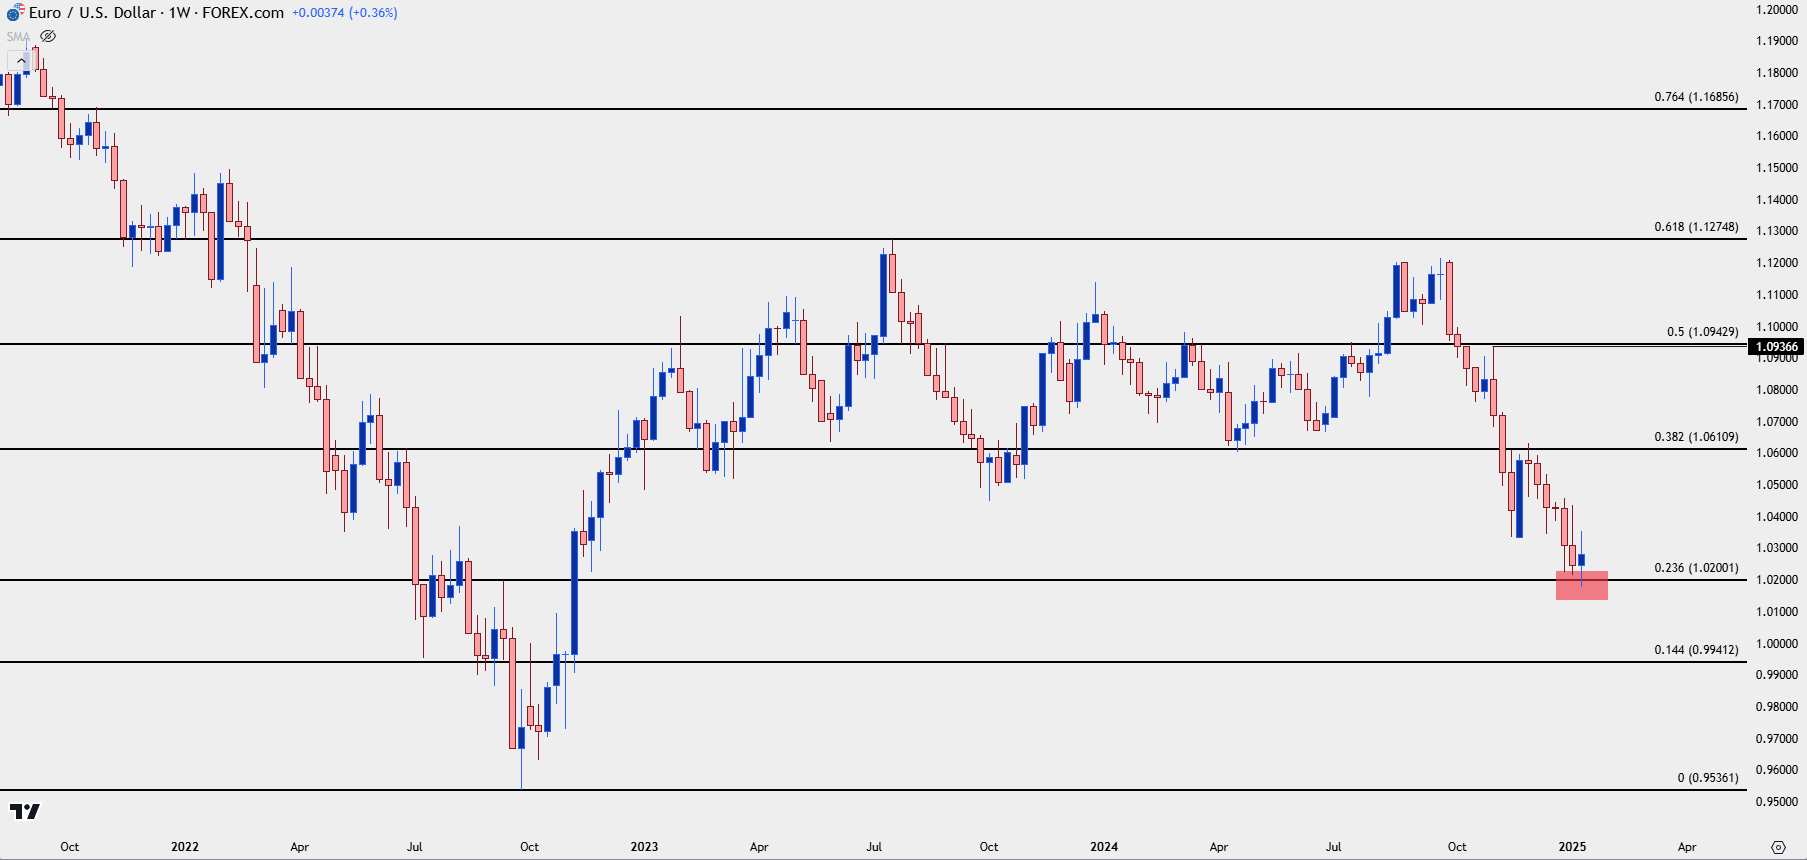 Chart prepared by James Stanley, EUR/USD on Tradingview
EUR/USD Shorter-Term
That support bounce certainly did not eliminate selling pressure as bears continued to defend the prior support swing of 1.0344. But – notably, each day of last week showed a higher-low after the Monday test of the 1.0200 level. This illustrates waning bearish pressure that could potentially allow for a turn. But – a lack of selling pressure at or near lows isn’t enough to allow for reversal scenarios, as we would also need to see bears relent, and that hasn’t yet happened.
From the daily chart, we can identify some key levels that could denote a turning of the tide. The 1.0300 psychological level remains key and above that, it’s the 1.0344 level. If bulls can force a breakout from that price, the next big test would be at the 1.0406 Fibonacci level, which last came into play on January 6th and 7th as it held bulls back before the sell-off that ultimately tested the 1.0200 handle last week.
EUR/USD Daily Chart
 Chart prepared by James Stanley, EUR/USD on Tradingview
EUR/JPY
While EUR/USD sellers had stalled last week, the same can’t be said in EUR/JPY, where the pair put in a fresh monthly low while testing below the 160.00 level on the chart.
Given the expectation for the ECB to continue cutting rates, this overlays well in EUR/JPY as we move into a week with a Bank of Japan rate decision. I had looked at the push of strength in Yen-pairs last week and as I noted then, EUR/JPY and GBP/JPY could both present more attractive scenarios of Yen-strength than the major pair of USD/JPY. I think that remains the case into next week and, so far in 2025, it’s been a consistent run of lower-lows and highs in EUR/JPY.
For resistance, there’s a Fibonacci level at 161.44 and then a prior price action swing at 162.04, both of which could function as lower-highs from the prior week swing high.
Below the 160.00 level, there’s a Fibonacci level at 158.66 after which the trendline connecting August and September swing lows comes into play.
EUR/JPY Daily Price Chart
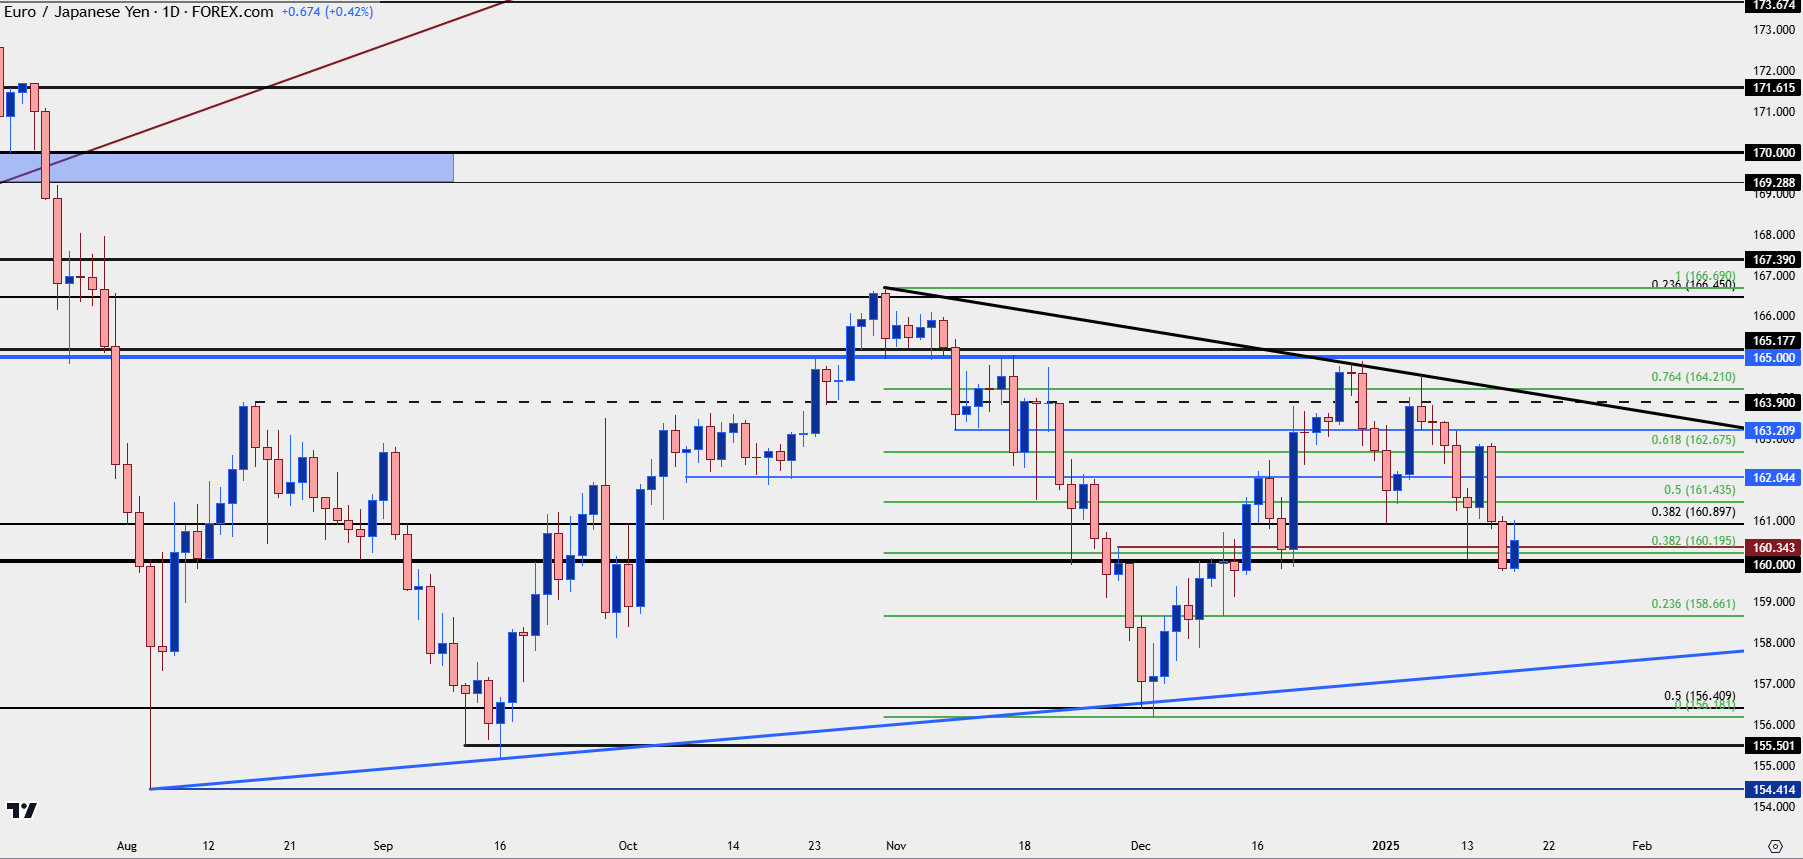 Chart prepared by James Stanley, EUR/JPY on Tradingview
EUR/GBP
In the prior week forecast for the British Pound, I took a look at EUR/GBP as the normally sleepy pair had started to show breakout tendencies. The .8401 level had been tested but bulls hadn’t yet been able to show a break above that and, instead, I drew attention towards the .8448 level that had previously marked the highs back in October.
That price came into play on Tuesday and then again on Wednesday. The pullback from that saw buyers push another bounce, with the price coming back into play on Friday, as well.
At this point bulls remain in-control as the recent higher-high goes along with a higher-low. But the next zone of resistance overhead could be a difficult spot for buyers to drive continuation, and that plots around the .8500 psychological level, which is confluent with a Fibonacci level that plots at .8512.
EUR/GBP Daily Chart
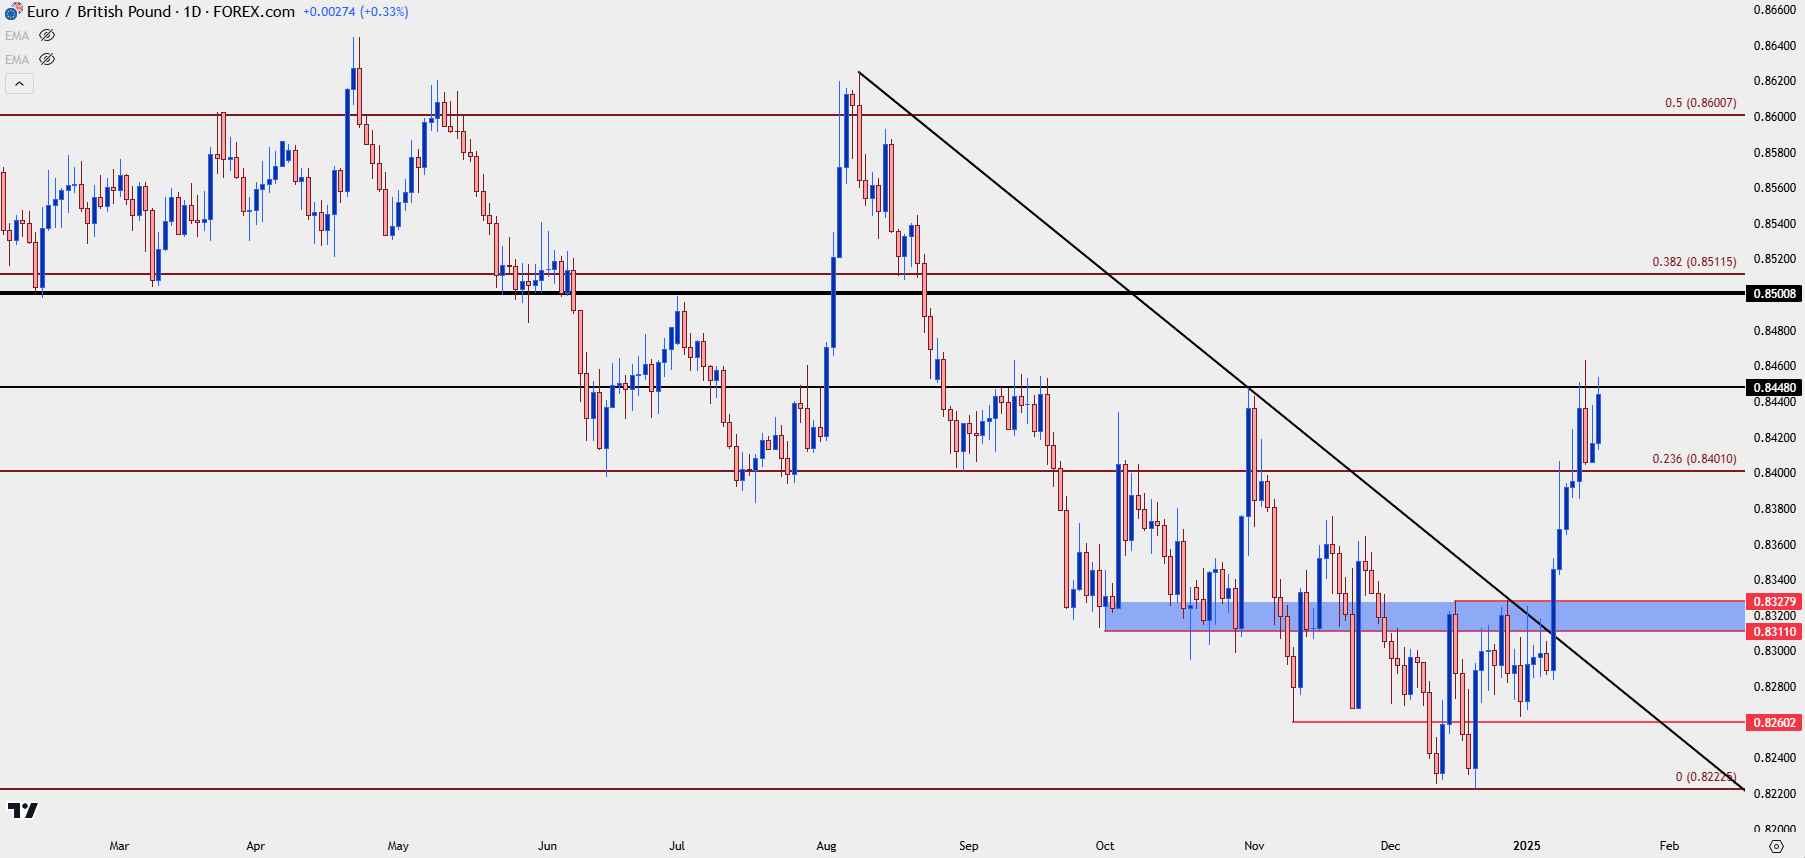 Chart prepared by James Stanley, EUR/GBP on Tradingview
--- written by James Stanley, Senior Strategist
Euro, EUR/USD Talking Points:
- EUR/USD posted its first green weekly bar since late-November, making the first green weekly candle in seven weeks.
- The pair ran into a major support level on Monday at the 1.0200 handle, which led to a dragonfly doji. And while sellers did continue to push, the rest of the week saw higher-lows each day through Friday.
- EUR/GBP put in a major reaction at a big level and EUR/JPY tested a breakdown: Both pairs are looked at below.
- I look at all three Euro pairs in the weekly webinar on Tuesday, and you’re welcome to join: Click here for registration information.
EUR/USD Finally Finds a Bounce
It’s been tough sledding for Euro bulls since the Q4 open last year and that’s particularly been the case over the past six weeks as there hasn’t been a green weekly bar since the late-November candle. That push lasted through early-December, until the 1.0611 Fibonacci level came into play to mark the high on the day of NFP that month. That then led to a decisive continuation in the sell-off, all the way through this week’s open when a major level came into play on Monday for EUR/USD.
The 1.0200 level is a key Fibonacci level, as this is the 23.6% retracement from the 2021-2022 major move. And from that same major move, the 61.8% retracement caught the high in 2023, and the 38.2% marker set the low for the first-half of last year. That same price then came back to mark resistance in December before sellers went on the attack and that push finally amounted to a test of the 23.6% marker earlier in the week.
EUR/USD Weekly Price Chart
EUR/USD Shorter-Term
That support bounce certainly did not eliminate selling pressure as bears continued to defend the prior support swing of 1.0344. But – notably, each day of last week showed a higher-low after the Monday test of the 1.0200 level. This illustrates waning bearish pressure that could potentially allow for a turn. But – a lack of selling pressure at or near lows isn’t enough to allow for reversal scenarios, as we would also need to see bears relent, and that hasn’t yet happened.
From the daily chart, we can identify some key levels that could denote a turning of the tide. The 1.0300 psychological level remains key and above that, it’s the 1.0344 level. If bulls can force a breakout from that price, the next big test would be at the 1.0406 Fibonacci level, which last came into play on January 6th and 7th as it held bulls back before the sell-off that ultimately tested the 1.0200 handle last week.
EUR/USD Daily Chart
EUR/JPY
While EUR/USD sellers had stalled last week, the same can’t be said in EUR/JPY, where the pair put in a fresh monthly low while testing below the 160.00 level on the chart.
Given the expectation for the ECB to continue cutting rates, this overlays well in EUR/JPY as we move into a week with a Bank of Japan rate decision. I had looked at the push of strength in Yen-pairs last week and as I noted then, EUR/JPY and GBP/JPY could both present more attractive scenarios of Yen-strength than the major pair of USD/JPY. I think that remains the case into next week and, so far in 2025, it’s been a consistent run of lower-lows and highs in EUR/JPY.
For resistance, there’s a Fibonacci level at 161.44 and then a prior price action swing at 162.04, both of which could function as lower-highs from the prior week swing high.
Below the 160.00 level, there’s a Fibonacci level at 158.66 after which the trendline connecting August and September swing lows comes into play.
EUR/JPY Daily Price Chart
EUR/GBP
In the prior week forecast for the British Pound, I took a look at EUR/GBP as the normally sleepy pair had started to show breakout tendencies. The .8401 level had been tested but bulls hadn’t yet been able to show a break above that and, instead, I drew attention towards the .8448 level that had previously marked the highs back in October.
That price came into play on Tuesday and then again on Wednesday. The pullback from that saw buyers push another bounce, with the price coming back into play on Friday, as well.
At this point bulls remain in-control as the recent higher-high goes along with a higher-low. But the next zone of resistance overhead could be a difficult spot for buyers to drive continuation, and that plots around the .8500 psychological level, which is confluent with a Fibonacci level that plots at .8512.
EUR/GBP Daily Chart
--- written by James Stanley, Senior Strategist
Related tags:



The complete CFD trading experience
Award-winning platforms, competitive spreads, low commissions and dedicated support.
We live and breathe the markets and are dedicated to helping traders realise their ambitions as we continue to set the industry bar.
Economic calendar
Web Trader platform
Our sophisticated web-based platform is packed with features.
Related articles

Euro Short-term Outlook: EUR/USD Selloff Nears Critical Yearly Support 9 23 2026
Euro has fallen seven of the past nine sessions, with stretched momentum raising the stakes as EUR/USD closes in on a major inflection zone.

EUR/USD, Nasdaq Price Outlook: Reversal Risks Build
EUR/USD and Nasdaq Price Outlook: Overbought/oversold momentum on hourly and daily time frames is raising reversal risks across the U.S. dollar, EUR/USD and Nasdaq after a strong weekly advance.


EUR/USD, Gold Forecast: Two trades to watch
EUR/USD falls to a 2-month low despite Eurozone growth picking up. Gold under pressure as a stronger USD offsets falling oil prices.

StoneX Europe Ltd may make third party material available on this website which may contain information included but not limited to the conditions of financial markets. The material is for information purposes only and does not contain, and should not be construed as containing, investment advice and/or investment recommendation and/or an investment research and/or an offer of or solicitation for any transactions in financial instruments; any decision to enter into a specific transaction shall be made by the client following an assessment by him/her of their situation.
StoneX Europe Ltd makes no representation or warranty and assumes no liability as to the accuracy or completeness of the information provided, nor any loss arising from any investment based on a recommendation, forecast or other information supplied. You should always seek independent advice as to your suitability to speculate in any related markets and your ability to assume the associated risks, if you are at all unsure. We are not under any obligation to update any such material. Any opinion made may be personal to the author and may not reflect the opinion of StoneX Europe Ltd.