




European Open: A (technical) case for a pullback in yields
As bond yields move inversely to bond prices, it should be taken note of that the US 10-year note has just tested a key level of support.
Share this:

Asian Indices:
- Australia's ASX 200 index rose by 56.9 points (0.77%) and currently trades at 7,469.30
- Japan's Nikkei 225 index has risen by 167.98 points (0.6%) and currently trades at 28,111.87
- Hong Kong's Hang Seng index has risen by 98.59 points (0.45%) and currently trades at 21,783.56
- China's A50 Index has fallen by -18.51 points (-0.14%) and currently trades at 13,402.16
UK and Europe:
- UK's FTSE 100 futures are currently up 30.5 points (0.41%), the cash market is currently estimated to open at 7,503.64
- Euro STOXX 50 futures are currently up 28 points (0.73%), the cash market is currently estimated to open at 3,915.10
- Germany's DAX futures are currently up 102 points (0.7%), the cash market is currently estimated to open at 14,519.37
US Futures:
- DJI futures are currently up 25 points (0.07%)
- S&P 500 futures are currently down -16.25 points (-0.11%)
- Nasdaq 100 futures are currently up 2.25 points (0.05%)


The US 10-year treasury note yielded over 2.5% yesterday for the first time in nearly three years. It’s been beneficial for the US dollar which has continued to outperform, particularly against the yen thanks to the BOJ’s ultra-dovish stance. But we have noted that the price of the 10-year note (which moves inversely to yields) has stalled at a key support zone around 94*12 to 94*30. And if that support zone holds and prompts a rally in prices, it should send yields lower. As it’s been a while since markets have experienced lower yields, any drop in them could inadvertently weigh on Wall Street whilst supporting safe havens such gold. Regardless of the outcome, bond yields remain a key market to watch.
FTSE 350: Market Internals


FTSE 350: 4194.43 (-0.14%) 28 March 2022
- 224 (63.82%) stocks advanced and 120 (34.19%) declined
- 9 stocks rose to a new 52-week high, 2 fell to new lows
- 36.47% of stocks closed above their 200-day average
- 47.01% of stocks closed above their 50-day average
- 17.66% of stocks closed above their 20-day average
Outperformers:
- + 4.80% - Moonpig Group PLC (MOONM.L)
- + 4.46% - TUI AG (TUIGn.DE)
- + 4.04% - Wizz Air Holdings PLC (WIZZ.L)
Underperformers:
- -10.7% - Rolls-Royce Holdings PLC (RR.L)
- -5.44% - PureTech Health PLC (PRTC.L)
- -4.69% - Vesuvius PLC (VSVS.L)
Consumers appear a tad confused
The Conference Board release their consumer confidence report at 15:00 GMT. But we see quite a divergence between consumer reports at present worth noting. Whilst the Conference Board survey is down from its 2021 high, it currently sits at 110.5 which is comfortably above its long-term average of 95.9. Meanwhile, the University of Michigan sentiment has plunged to a 10.5 year low and fell beneath its long-term average 9-months ago. But if we look past the huge gap of the headline data, a common theme shred by both surveys is that current conditions and expectations are pointing lower. And when consumers stop consuming, it weighs on growth prospects. Therefore, another weak print today only exacerbates concerns of stagflation with such high levels of inflation.
USD/CHF pulls back into support
Price action on USD/CHD leading into March was very choppy, but we are now seeing spells of cleaner price action which suggests it is tyring to form a trend. From the 7th of March it rallied over 3.3% over the next seven days before pulling back within a continuation pattern (which appears to be some form of falling wedge). Yesterday we saw prices closed firmly above the wedge’s trend resistance and tap 0.9380 before entering a period of consolidation.

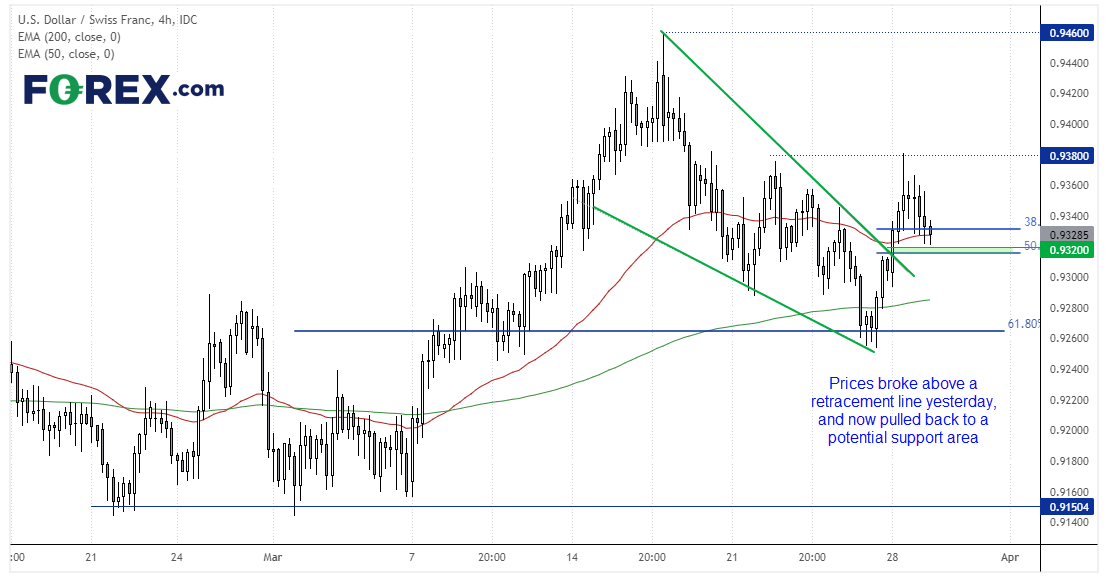
We can see on the four-hour chart that that its retracement is trying to build support around its 50-bar eMA and 38.2% Fibonacci level, but we also have the 50% level around 0.9320 for potential support should this retracement grind lower. From here we are now awaiting a bullish candle to for and signal that momentum has realigned with its bullish trend, to then target the 0.9380 high and breakout towards the base of the wedge at 0.9460.
Up Next (Times in GMT)
How to trade with City Index
You can easily trade with City Index by using these four easy steps:
- Open an account, or log in if you’re already a customer
• Open an account in the UK
• Open an account in Australia
• Open an account in Singapore
- Search for the company you want to trade in our award-winning platform
- Choose your position and size, and your stop and limit levels
- Place the trade
How to trade with FOREX.com
Follow these easy steps to start trading with FOREX.com today:
- Open a Forex.com account, or log in if you’re already a customer.
- Search for the pair you want to trade in our award-winning platform.
- Choose your position and size, and your stop and limit levels.
- Place the trade.
Related tags:
Latest market news




The complete CFD trading experience
Award-winning platforms, competitive spreads, low commissions and dedicated support.
We live and breathe the markets and are dedicated to helping traders realise their ambitions as we continue to set the industry bar.
Economic calendar
Web Trader platform
Our sophisticated web-based platform is packed with features.
Related articles
EUR/USD weekly outlook: Oil, inflation and NFP in focus
After coming under significant pressure in recent weeks, the EUR/USD came off its lows to finish the week on a positive note on Friday, albeit with only a mild rebound. That was not enough to prevent the exchange rate falling for the third consecutive week, as the US dollar and bond yields rallied across the board.

Gold Q4 2026 outlook: Resilience in the face of rallying dollar and yields
As we headed towards the latter stages of Q3 and into Q4, the Fed had just hiked rates in a hawkish FOMC meeting, while the likes of the ECB and BoJ had also tightened their respective policies. Oil prices remained elevated amid the prolonged US-Iran conflict. Meanwhile, bond yields were breaking out, and the dollar was higher across the board. Yet, remarkably, gold was still holding in the positive territory for the third quarter, even if it had weakened somewhat in September.

EUR/USD Q4 2026 Outlook: Euro at a Crossroads as Fed, ECB Tighten 9 25 2026
EUR/USD enters Q4 at a pivotal inflection point as competing Fed-ECB policy paths and persistent inflation risks collide with major technical support.

StoneX Europe Ltd may make third party material available on this website which may contain information included but not limited to the conditions of financial markets. The material is for information purposes only and does not contain, and should not be construed as containing, investment advice and/or investment recommendation and/or an investment research and/or an offer of or solicitation for any transactions in financial instruments; any decision to enter into a specific transaction shall be made by the client following an assessment by him/her of their situation.
StoneX Europe Ltd makes no representation or warranty and assumes no liability as to the accuracy or completeness of the information provided, nor any loss arising from any investment based on a recommendation, forecast or other information supplied. You should always seek independent advice as to your suitability to speculate in any related markets and your ability to assume the associated risks, if you are at all unsure. We are not under any obligation to update any such material. Any opinion made may be personal to the author and may not reflect the opinion of StoneX Europe Ltd.