



EUR/USD continues to make new 15-month lows
Given the Euro makes up 57% of the DXY, much of the reason for the new lows in EUR/USD is because DXY is making new yearly highs!
Share this:

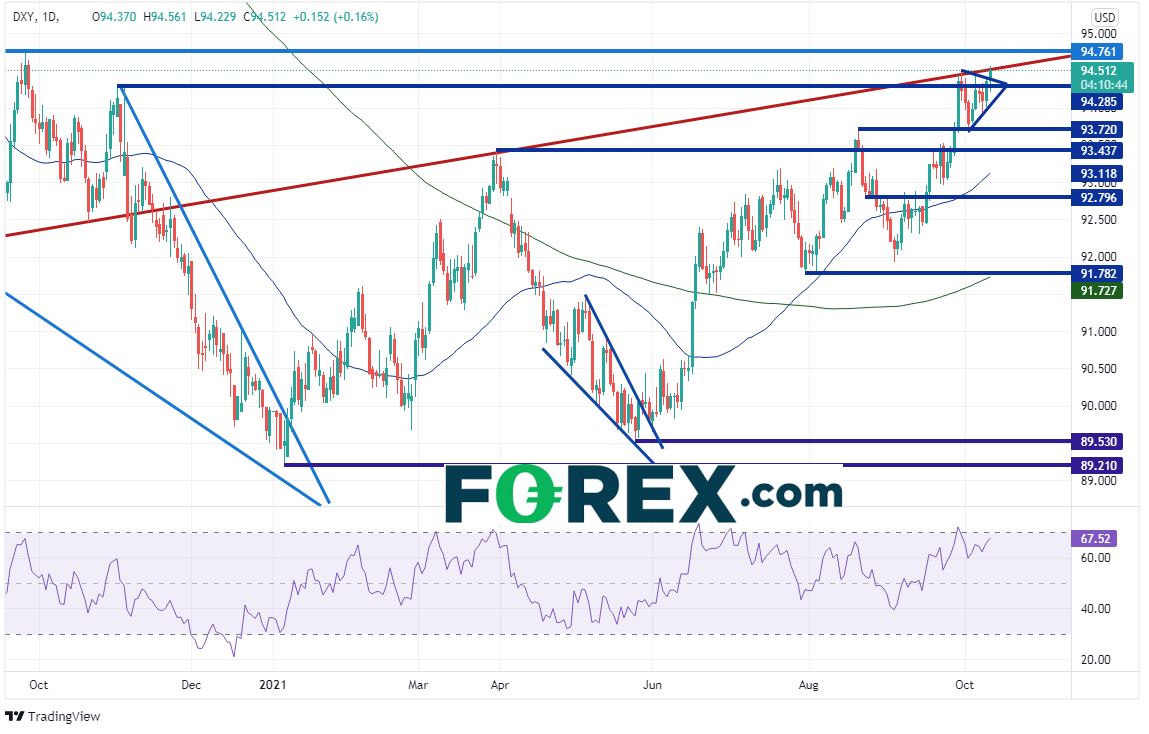
EUR/USD continues to make lower lows and lower highs. And that, by definition, is a downtrend. However, it may not have as much to do with the Euro, and it has to do with the US Dollar. The US Dollar Index broke out of a short-term symmetrical triangle near 94.40 and is desperately trying to push above a long term trendline (red) dating back to 2011. Price halted at the trendline, hear 94.56 as it moves towards the September 24th, 2020 highs of 94.76.
Source: Tradingview, Stone X
What is the US Dollar Index (DXY)?
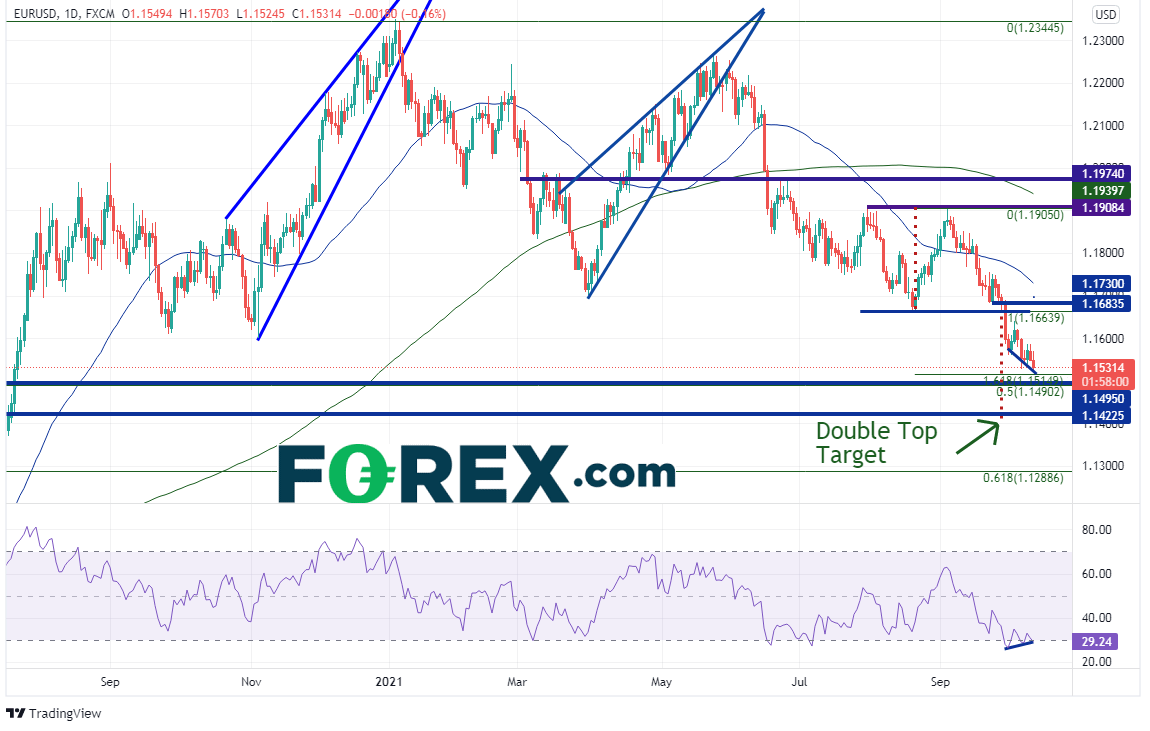
EUR/USD makes up 57% of the US Dollar Index (DXY), so it’s no surprise that as the DXY pushes towards new highs, that EUR/USD is moving in a similar, but opposite, direction. Today, the pair reached a low of 1.1524 thus far, its lowest level since July 21st, 2020. Price formed a double top near 1.1905 back in August and September, and finally broke lower on September 29th. The target for the double top is near 1.1400, however price must first pass through strong support between 1.1490 and 1.1515, which is:
- The 161.8% Fibonacci retracement from the August 20th lows to the September 3rd highs
- The 50% retracement level from the March 2020 lows to the January 6th highs
- Horizontal support dating back to spike highs from March 2020
Source: Tradingview, Stone X
Notice also that the RSI is diverging from price, an indication that price may be ready for a bounce.
Trade EUR/USD now: Login or open a new account!
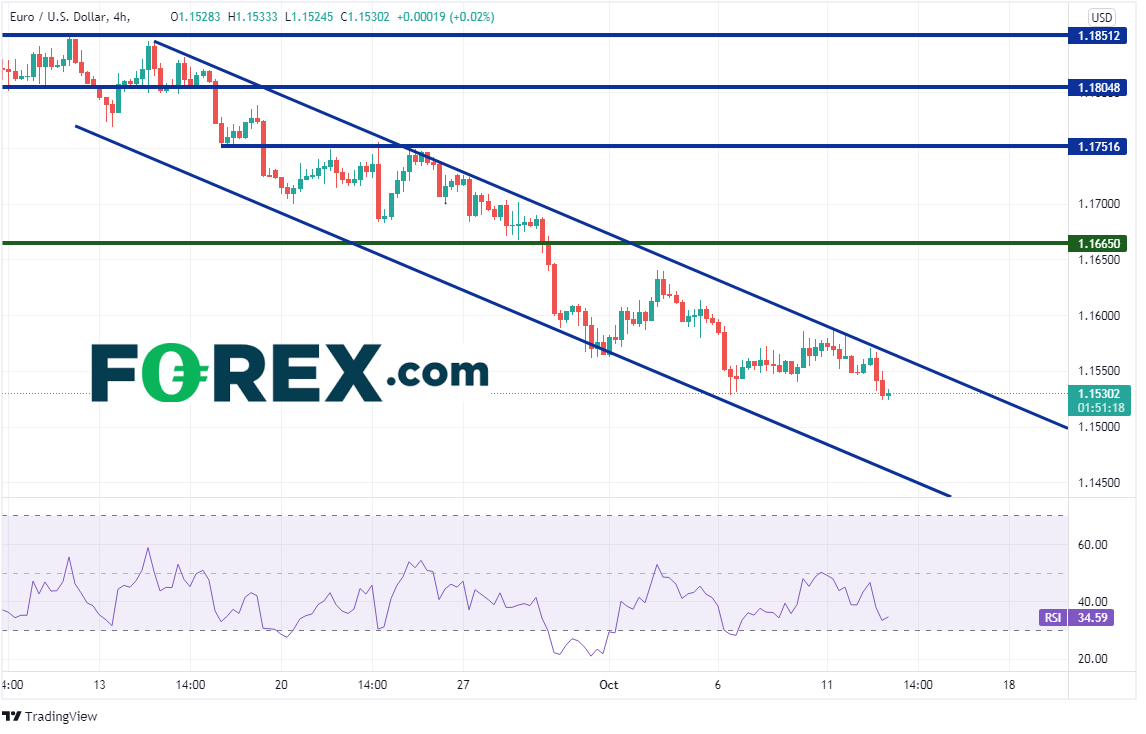
On a 240-minute timeframe, the downtrend is much more noticeable within the channel. In addition to the support mentioned above as price moves towards the double top target, there is also currently support at the bottom trendline of the downward sloping channel near 1.1460. Resistance is above at the top downward sloping trendline near today’s highs of 1.1570. If price breaks above, there is resistance at the neckline of the double top near 1.1665 and then the 50-Day Moving Average (see daily) near 1.1730.
Source: Tradingview, Stone X
EUR/USD has reached its lowest level since July 21st, 2020. However, note that it’s probably not all due to the Euro. Given the Euro makes up 57% of the DXY, it seems much of the reason for the new lows is because DXY is putting in new yearly highs!
Learn more about forex trading opportunities.
EUR/USD continues to make lower lows and lower highs. And that, by definition, is a downtrend. However, it may not have as much to do with the Euro, and it has to do with the US Dollar. The US Dollar Index broke out of a short-term symmetrical triangle near 94.40 and is desperately trying to push above a long term trendline (red) dating back to 2011. Price halted at the trendline, hear 94.56 as it moves towards the September 24th, 2020 highs of 94.76.

Source: Tradingview, Stone X
What is the US Dollar Index (DXY)?
EUR/USD makes up 57% of the US Dollar Index (DXY), so it’s no surprise that as the DXY pushes towards new highs, that EUR/USD is moving in a similar, but opposite, direction. Today, the pair reached a low of 1.1524 thus far, its lowest level since July 21st, 2020. Price formed a double top near 1.1905 back in August and September, and finally broke lower on September 29th. The target for the double top is near 1.1400, however price must first pass through strong support between 1.1490 and 1.1515, which is:
- The 161.8% Fibonacci retracement from the August 20th lows to the September 3rd highs
- The 50% retracement level from the March 2020 lows to the January 6th highs
- Horizontal support dating back to spike highs from March 2020

Source: Tradingview, Stone X
Notice also that the RSI is diverging from price, an indication that price may be ready for a bounce.
Trade EUR/USD now: Login or Open a new account!
• Open an account in the UK
• Open an account in Australia
• Open an account in Singapore
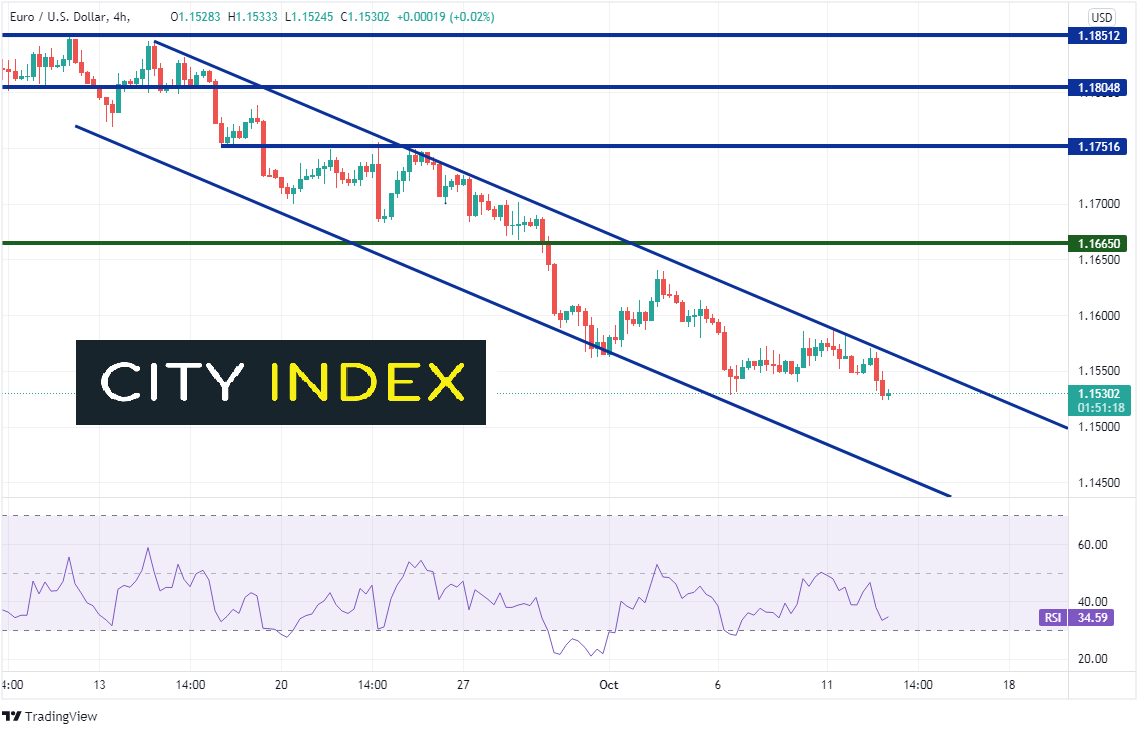
On a 240-minute timeframe, the downtrend is much more noticeable within the channel. In addition to the support mentioned above as price moves towards the double top target, there is also currently support at the bottom trendline of the downward sloping channel near 1.1460. Resistance is above at the top downward sloping trendline near today’s highs of 1.1570. If price breaks above, there is resistance at the neckline of the double top near 1.1665 and then the 50-Day Moving Average (see daily) near 1.1730.
Source: Tradingview, Stone X
EUR/USD has reached its lowest level since July 21st, 2020. However, note that it’s probably not all due to the Euro. Given the Euro makes up 57% of the DXY, it seems much of the reason for the new lows is because DXY is putting in new yearly highs!
Learn more about forex trading opportunities.
Related tags:
Latest market news




The complete CFD trading experience
Award-winning platforms, competitive spreads, low commissions and dedicated support.
We live and breathe the markets and are dedicated to helping traders realise their ambitions as we continue to set the industry bar.
Economic calendar
Web Trader platform
Our sophisticated web-based platform is packed with features.
Related articles
RBA delivers 25bp hike, Bullock now the main event
The RBA delivered the expected 25bp hike, but Bullock’s press conference now looms as the bigger volatility risk for AUD/USD and the ASX 200.
Gold outlook: XAU/USD hammered, stretched and vulnerable to a sharp rebound
Gold is getting hammered for solid fundamental reasons, but history suggests extreme four-hourly oversold conditions can produce violent countertrend rallies.
EUR/USD, USD/JPY Outlook: Oil, yields and an FX identity crisis
Crude oil is setting the tone across rates and FX, leaving EUR/USD vulnerable and USD/JPY caught between higher Treasury yields and the growing threat of intervention
StoneX Europe Ltd may make third party material available on this website which may contain information included but not limited to the conditions of financial markets. The material is for information purposes only and does not contain, and should not be construed as containing, investment advice and/or investment recommendation and/or an investment research and/or an offer of or solicitation for any transactions in financial instruments; any decision to enter into a specific transaction shall be made by the client following an assessment by him/her of their situation.
StoneX Europe Ltd makes no representation or warranty and assumes no liability as to the accuracy or completeness of the information provided, nor any loss arising from any investment based on a recommendation, forecast or other information supplied. You should always seek independent advice as to your suitability to speculate in any related markets and your ability to assume the associated risks, if you are at all unsure. We are not under any obligation to update any such material. Any opinion made may be personal to the author and may not reflect the opinion of StoneX Europe Ltd.