



EURUSD, Nasdaq Forecast: Are Markets Ready to Reverse?
EURUSD, Nasdaq Forecast: While chart indicators are flashing warning signs not seen since 2008, the once reliable 'buy the dip' mentality is starting to falter. Trump's tariff decisions could be ushering in a new market era—one that challenges bullish convictions across asset classes.
Share this:
Key Volatility Risks This Week:
- Trade war developments – escalation or resolution
- Chinese and U.S. CPI figures – Thursday
- U.S. Consumer Sentiment data – Friday
- Q1 Bank earnings – Friday: JPMorgan, Wells Fargo, Morgan Stanley, and BlackRock
While chart indicators are flashing signals last seen in 2008, the widely followed “buy the dip” mentality is on shaky ground. Trump's tariff decisions may be ushering in a new market era, challenging bullish narratives across asset classes. However, the link between weak market sentiment and a potential reversal is still being closely watched from a technical standpoint.
Technical Analysis: Quantifying Uncertainties
EURUSD Monthly Time Frame – Log Scale

Source: Tradingview
With the dollar on a downturn, EURUSD is now testing the upper boundary of a long-term descending parallel channel dating back to the 2008 highs. This level coincides with key resistance near 1.12. A sustained breakout above 1.1270 could mark a structural shift, turning the pair’s primary downtrend into a bullish reversal, with upside targets at 1.15, 1.17, and 1.19.
On the other side, if the upper boundary holds as resistance—especially given overbought conditions on the daily charts—EURUSD may retreat towards support levels at 1.07 and 1.05. Shorter-term technical levels are outlined in the next chart.
EURUSD 3-Day Time Frame – Log Scale
Source: Tradingview
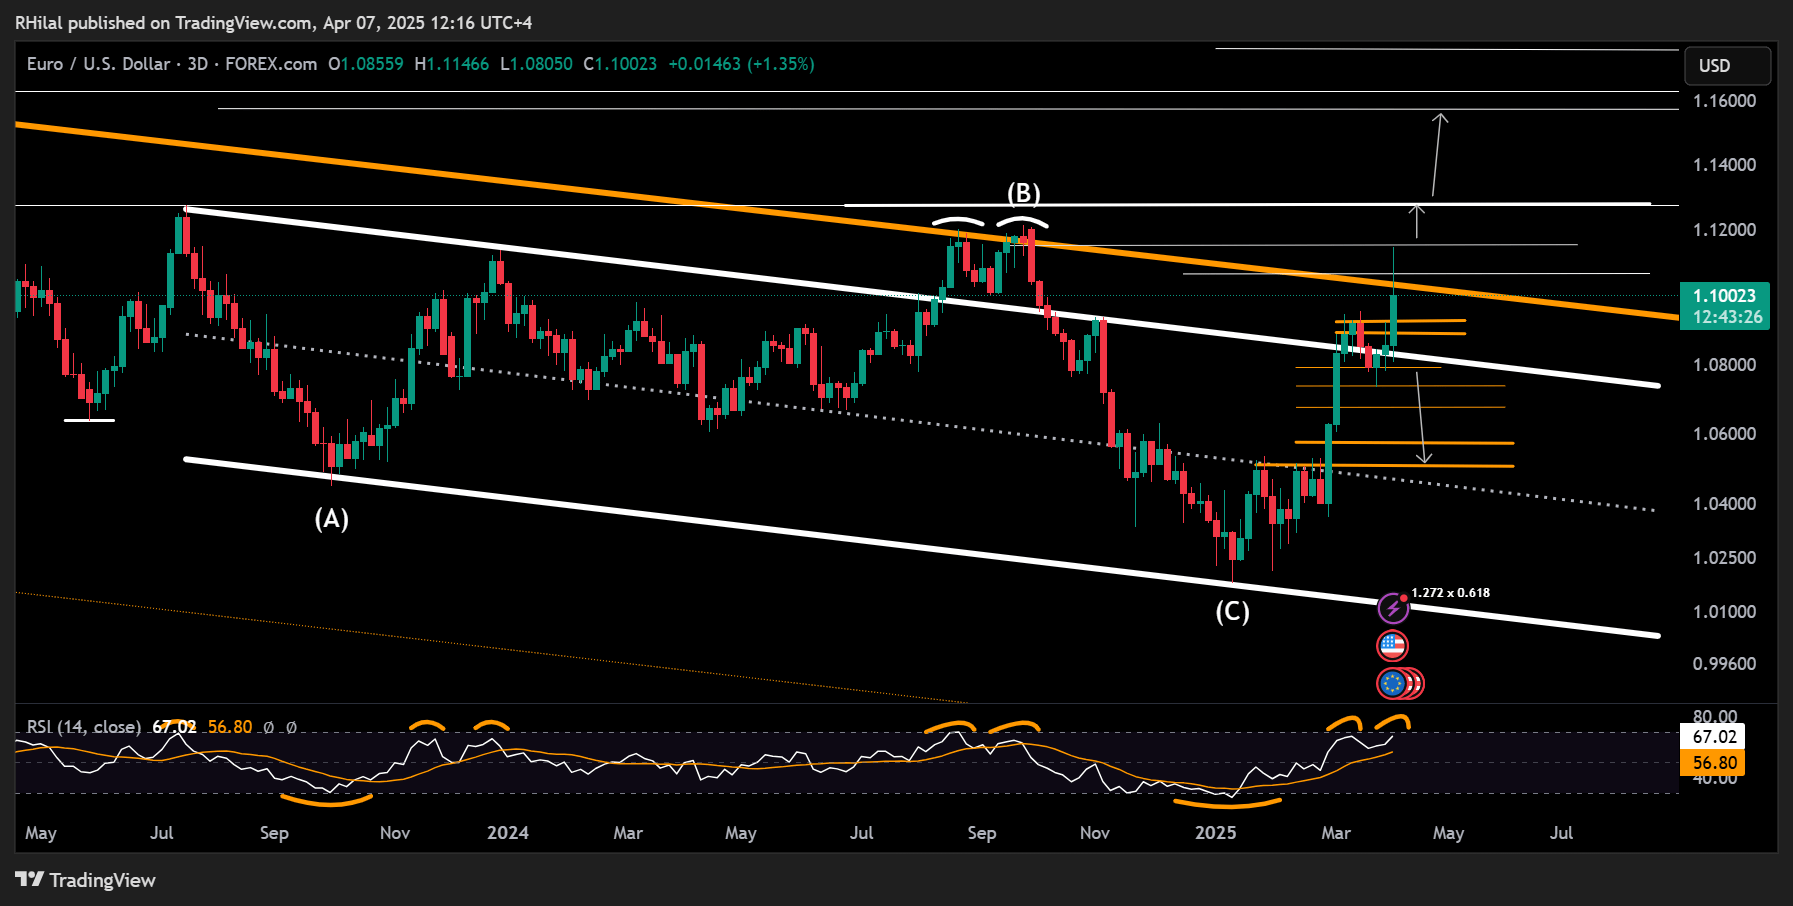
On the 3-day chart, the pair remains within the boundaries of a descending price channel formed between July 2023 and January 2025. The upper bounds of this range, around 1.0820 and 1.0780, could act as support should the price fall below the 1.09 handle. A decisive break below 1.0780 would open the path toward 1.0730, 1.0670, and 1.0570.
Should this support zone hold, the next area of resistance—and the key battleground for trend direction—lies between 1.1150 and 1.1270. A breakthrough this region would support a continued bullish reversal from the 2025 lows.
Nasdaq Weekly Time Frame – Log Scale
Source: Tradingview
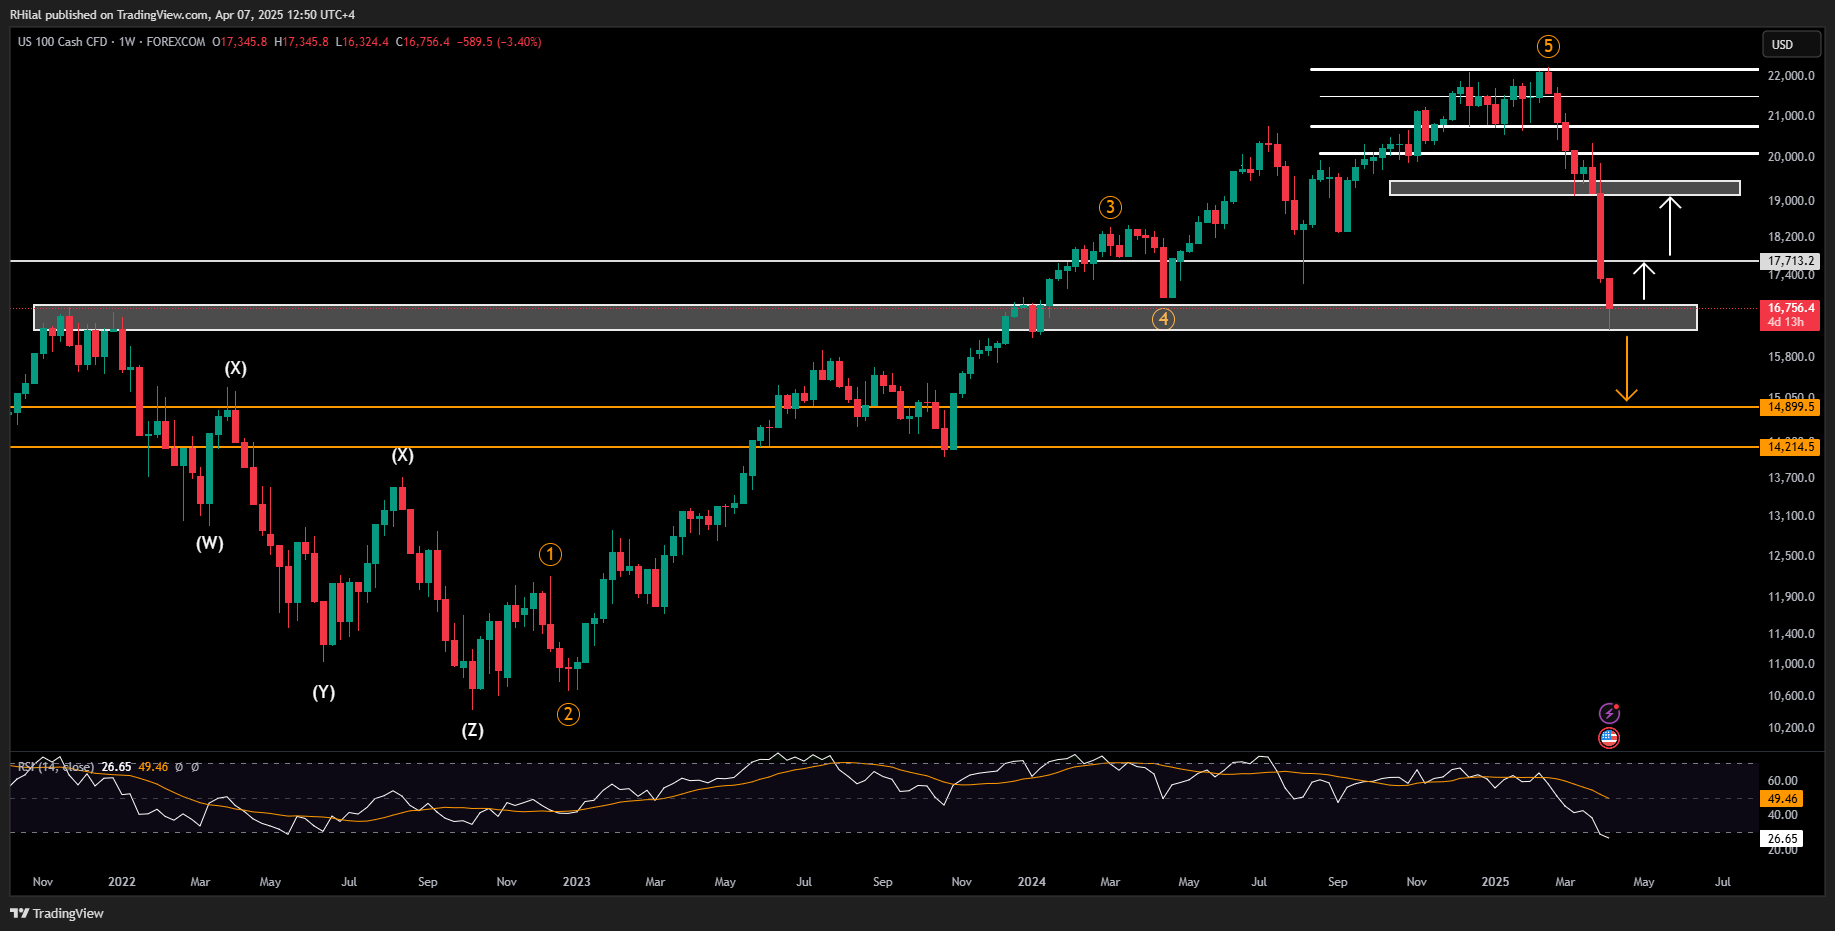
The Nasdaq recently bounced off the 50% Fibonacci retracement of its uptrend from the October 2022 low (10,430) to the February 2025 high (22,144). This level aligns closely with the 2021 highs near 16,300 and is coupled with an oversold weekly RSI—levels not seen since 2008.
Despite this technical rebound, sentiment remains fragile. With Trump holding tariffs, market confidence is aligning with bear market territory. Still, as the saying goes, markets tend to rebound when headlines hit peak pessimism.
Scenarios Ahead:
- Bearish: A decisive break below the 16,300 support level could trigger a drop toward the 61.8% Fibonacci retracement, around the 15,000–14,900 zone.
- Bullish: If support holds and RSI begins to recover from historically oversold conditions, the index could resume its upward trajectory, targeting 17,700, 19,100, 19,400, and potentially 20,000.
Written by Razan Hilal, CMT
Follow on X: @Rh_waves
Related tags:


The complete CFD trading experience
Award-winning platforms, competitive spreads, low commissions and dedicated support.
We live and breathe the markets and are dedicated to helping traders realise their ambitions as we continue to set the industry bar.
Economic calendar
Web Trader platform
Our sophisticated web-based platform is packed with features.
Related articles
Nasdaq 100 Forecast: NDX slips as Treasury yields keep rising
U.S. stocks are falling at the start of Q4, as gains in software stocks offset concerns over soaring Treasury yields. U.S. Treasury yields continue to rise, with the 10-year yield up 2 basis points at 5.31% and the 30-year at 5.66%, multi-decade highs.

US Dollar Technical Outlook: DXY Bulls Meet Resistance at Yearly Highs 10 1 2026
The U.S. Dollar has held firm despite fading Fed hike bets, but Friday’s payrolls could test the rally’s staying power.


EUR/USD, GBP/USD Outlook: RSI Hits 2020 Oversold Levels
EUR/USD, GBP/USD Outlook: The EUR/USD daily RSI has fallen to oversold levels last seen in 2020, raising the risk of a reversal across correlated currency pairs, including the US dollar and GBP/USD.
StoneX Europe Ltd may make third party material available on this website which may contain information included but not limited to the conditions of financial markets. The material is for information purposes only and does not contain, and should not be construed as containing, investment advice and/or investment recommendation and/or an investment research and/or an offer of or solicitation for any transactions in financial instruments; any decision to enter into a specific transaction shall be made by the client following an assessment by him/her of their situation.
StoneX Europe Ltd makes no representation or warranty and assumes no liability as to the accuracy or completeness of the information provided, nor any loss arising from any investment based on a recommendation, forecast or other information supplied. You should always seek independent advice as to your suitability to speculate in any related markets and your ability to assume the associated risks, if you are at all unsure. We are not under any obligation to update any such material. Any opinion made may be personal to the author and may not reflect the opinion of StoneX Europe Ltd.