


For a month of ‘heavy metal’, gold hasn’t done too badly
To say March has been a volatile ride for metals would be an understatement. Yet despite sustained losses for palladium and platinum, gold seems less willing to break lower.
Share this:

A couple of themes have done their bit to make trading metals a white-knuckle ride in March. Supply concerns which stemmed from the war in Ukraine helped industrial metals rally and, in some cases, hit record highs (for a brief moment). Yet it was the major short squeeze on LME’s nickel market which seemingly popped metal’s bubble and sending copper and palladium sharply lower from their record highs, before gold and silver eventually followed.
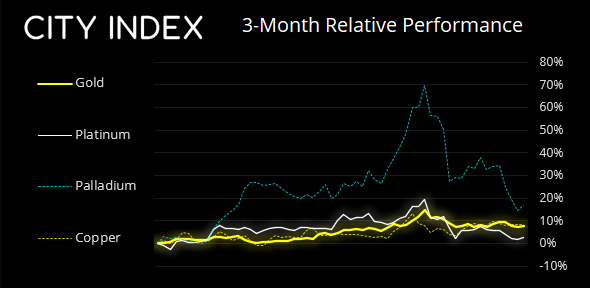
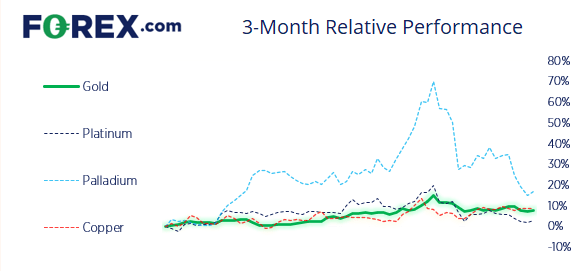
Palladium’s most volatile month since the pandemic
To give a better idea of the levels of volatility witnessed these past few weeks, It’s been the most volatile month for palladium since March 2020. And it’s certainly felt the strain of its own weight, having fallen around 40% from this-months high. Platinum has ‘only’ fallen as much as 20% from March’s high but, like palladium, it’s also on track for a bearish engulfing month. Copper also hit a brief record high on the 7th March before tumbling -11%, but it is now trading just -5.8% from its record high – which is not bad considering the lockdowns in Shanghai. But it is these high levels of volatility which has prompted money managers to run for cover and reduce exposure to such markets during a time of crisis. And that is the perfect environment for volatility and choppy trade.
We cannot say with any certainty that the lows are in for platinum and palladium. But with different macro drivers at play for gold, we think it is likely to outperform these metals over the foreseeable future.
Gold traders seem wary of Russia’s intensions
As nice as the peace talks initially sound, there’s scepticism over Russia’s true intensions. They haven’t been true to their word with humanitarian corridors, and its possible their pledge to scale down their ‘military operations’ around Kyiv is simply a ploy to disperse their troops elsewhere. And that is only half of the equation, as traders are keeping an eye on US inflation data, and the US dollar is pulling back along with yields which are helping to support gold.
It's a fine line between bullish and bearish for gold in March
Despite the rise in volatility, it is a close call as to whether gold will finish higher or low by tomorrow’s close. Gold spot prices for gold closed around 1908, and the market now trades just 0.8% above that level. So with month and quarter-end flows likely to wreak havoc heading into the weekend, it’s almost a flip of a coin as to whether March will be bullish or bearish for the metal.
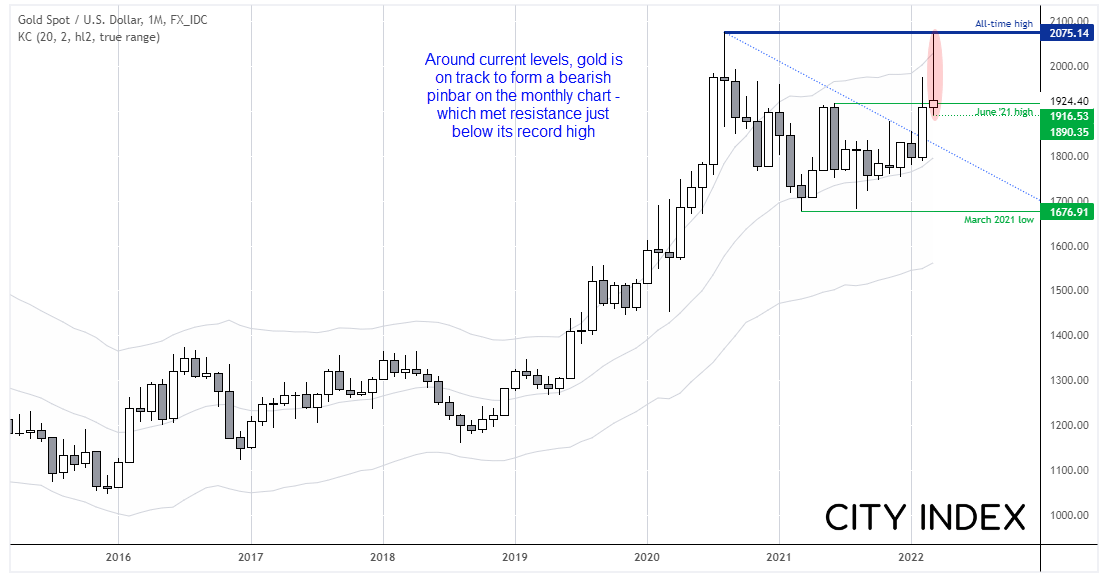
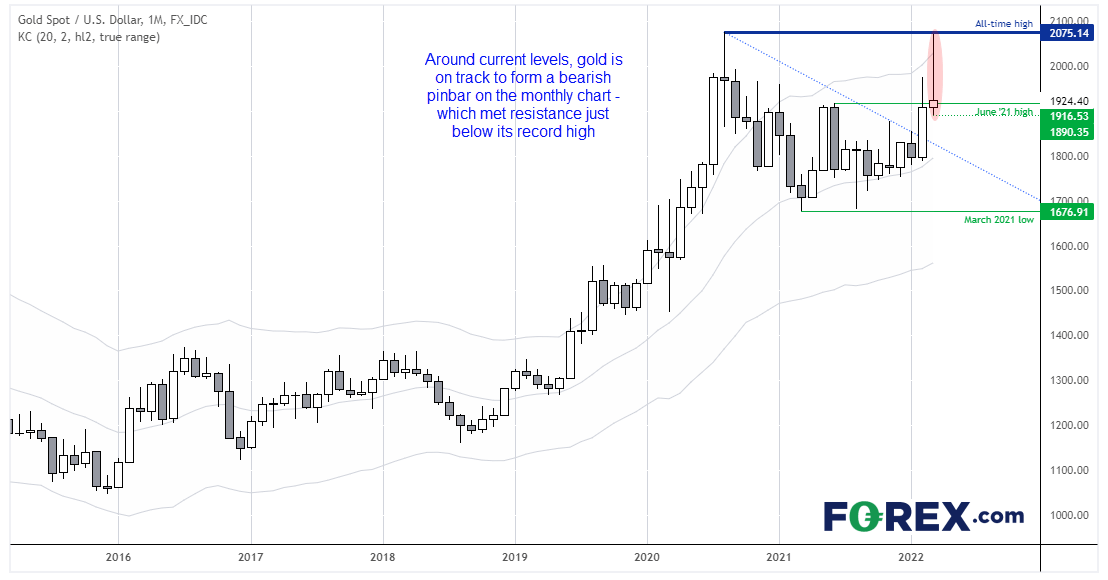
Technically, we’re on track for a large bearish pinbar on the monthly chart, and its high stopped just -$5 from its record high. It raises the question as to whether we’re now entering a corrective phase on this timeframes, but a month is a long time for the typical trader, and that still leaves bullish and bearish opportunities on lower timeframes. But if nothing else, a cursory glance at the monthly chart does not harm to remind us of the bigger picture. My gut feel at present is that we’ll see choppy trade over the coming weeks.
Gold is trying to find support around 1900
Menacing monthly candles aside, the weekly chart shows us that the market is trying to form a base around 1900. Despite a high chance of two bearish candles over three weeks being on the horizon, prices have bounced back twice from 1900 and (on the daily chart) have closed back above the June high of 1916.50. These are key levels to monitor going forward as demand is clearly residing there.
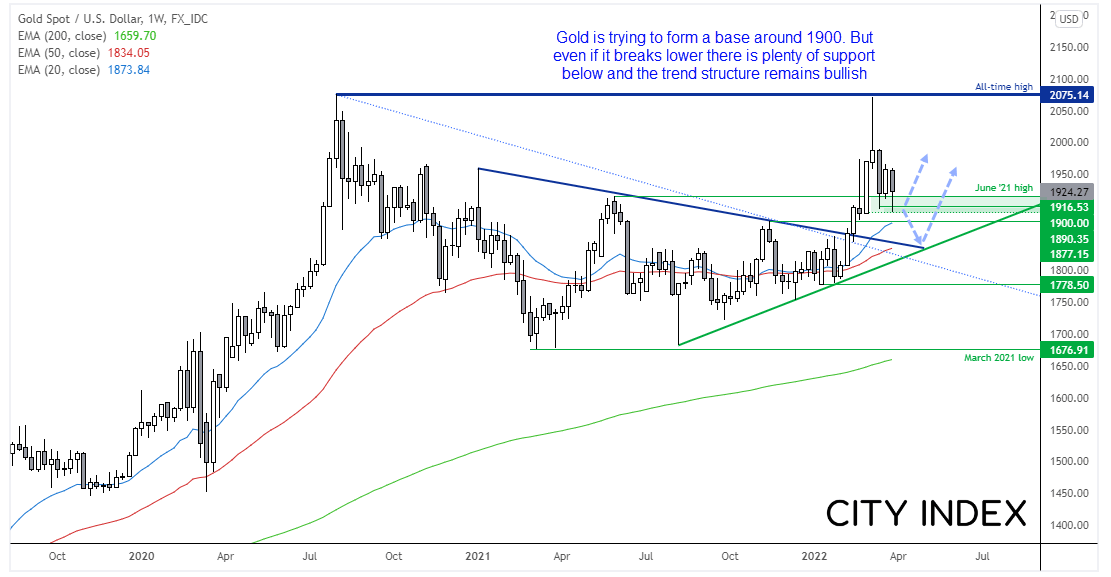
Given gold’s reluctance to trade below 1900 then rebound quickly back to 1916, we see upside potential for gold over the near-term. And 1930 is within easy reach for today, but until we see a daily close outside the 1900-1950 area, we suspect conditions will remain choppy and traders would be wise to remain nimble.
How to trade with City Index
You can easily trade with City Index by using these four easy steps:
- Open an account, or log in if you’re already a customer
• Open an account in the UK
• Open an account in Australia
• Open an account in Singapore
- Search for the company you want to trade in our award-winning platform
- Choose your position and size, and your stop and limit levels
- Place the trade
How to trade with FOREX.com
Follow these easy steps to start trading with FOREX.com today:
- Open a Forex.com account, or log in if you’re already a customer.
- Search for the pair you want to trade in our award-winning platform.
- Choose your position and size, and your stop and limit levels.
- Place the trade.
Related tags:
Latest market news




The complete CFD trading experience
Award-winning platforms, competitive spreads, low commissions and dedicated support.
We live and breathe the markets and are dedicated to helping traders realise their ambitions as we continue to set the industry bar.
Economic calendar
Web Trader platform
Our sophisticated web-based platform is packed with features.
Related articles
Australian Dollar Short-term Outlook: AUD/USD 3% Plunge Puts Multi-Month Range at Risk 11 6 2026
A sharp equity-led selloff has driven AUD/USD toward critical June-low support, with strong NFP data adding pressure ahead of next week’s U.S. CPI.

Nasdaq 100 forecast: Tech stocks rebound but AI concerns linger
The Nasdaq 100 rebound has run into former support as fears over AI regulation and spending linger. Fawad Razaqzada explains why he maintains a cautious forecast and where the key levels sit.


Dollar forecast: NFP provides dollar, already supported amid tech sell-off, additional boost
The US dollar has found some mild amid the tech rout in recent days, most visibly against risk sensitive and commodity dollars. Today, we have so far seen a bit of a recovery in global indices from their overnight lows. Investors will be watching the markets to see whether fresh losses will be on the again once Wall Street gets going. Ahead of that, we have just seen the release of the October US non-farm payrolls report – and it was much stronger at 165K than expected.
StoneX Europe Ltd may make third party material available on this website which may contain information included but not limited to the conditions of financial markets. The material is for information purposes only and does not contain, and should not be construed as containing, investment advice and/or investment recommendation and/or an investment research and/or an offer of or solicitation for any transactions in financial instruments; any decision to enter into a specific transaction shall be made by the client following an assessment by him/her of their situation.
StoneX Europe Ltd makes no representation or warranty and assumes no liability as to the accuracy or completeness of the information provided, nor any loss arising from any investment based on a recommendation, forecast or other information supplied. You should always seek independent advice as to your suitability to speculate in any related markets and your ability to assume the associated risks, if you are at all unsure. We are not under any obligation to update any such material. Any opinion made may be personal to the author and may not reflect the opinion of StoneX Europe Ltd.