






GBP/USD Holds 2025 Records, Dow Maintains 42,000 Rebound
GBP/USD, Dow Outlook: As GBP/USD tests 2025 highs and critical resistance levels, the Dow holds firm in bullish territory ahead of NVIDIA’s earnings. What are the key levels to watch?
Share this:

Key Events to Watch:
- FOMC Minutes & NVIDIA Earnings
- U.S. GDP Second Estimate (Thursday)
- BOE Governor Bailey’s Speech (Thursday)
- U.S. Core PCE Price Index (Friday)
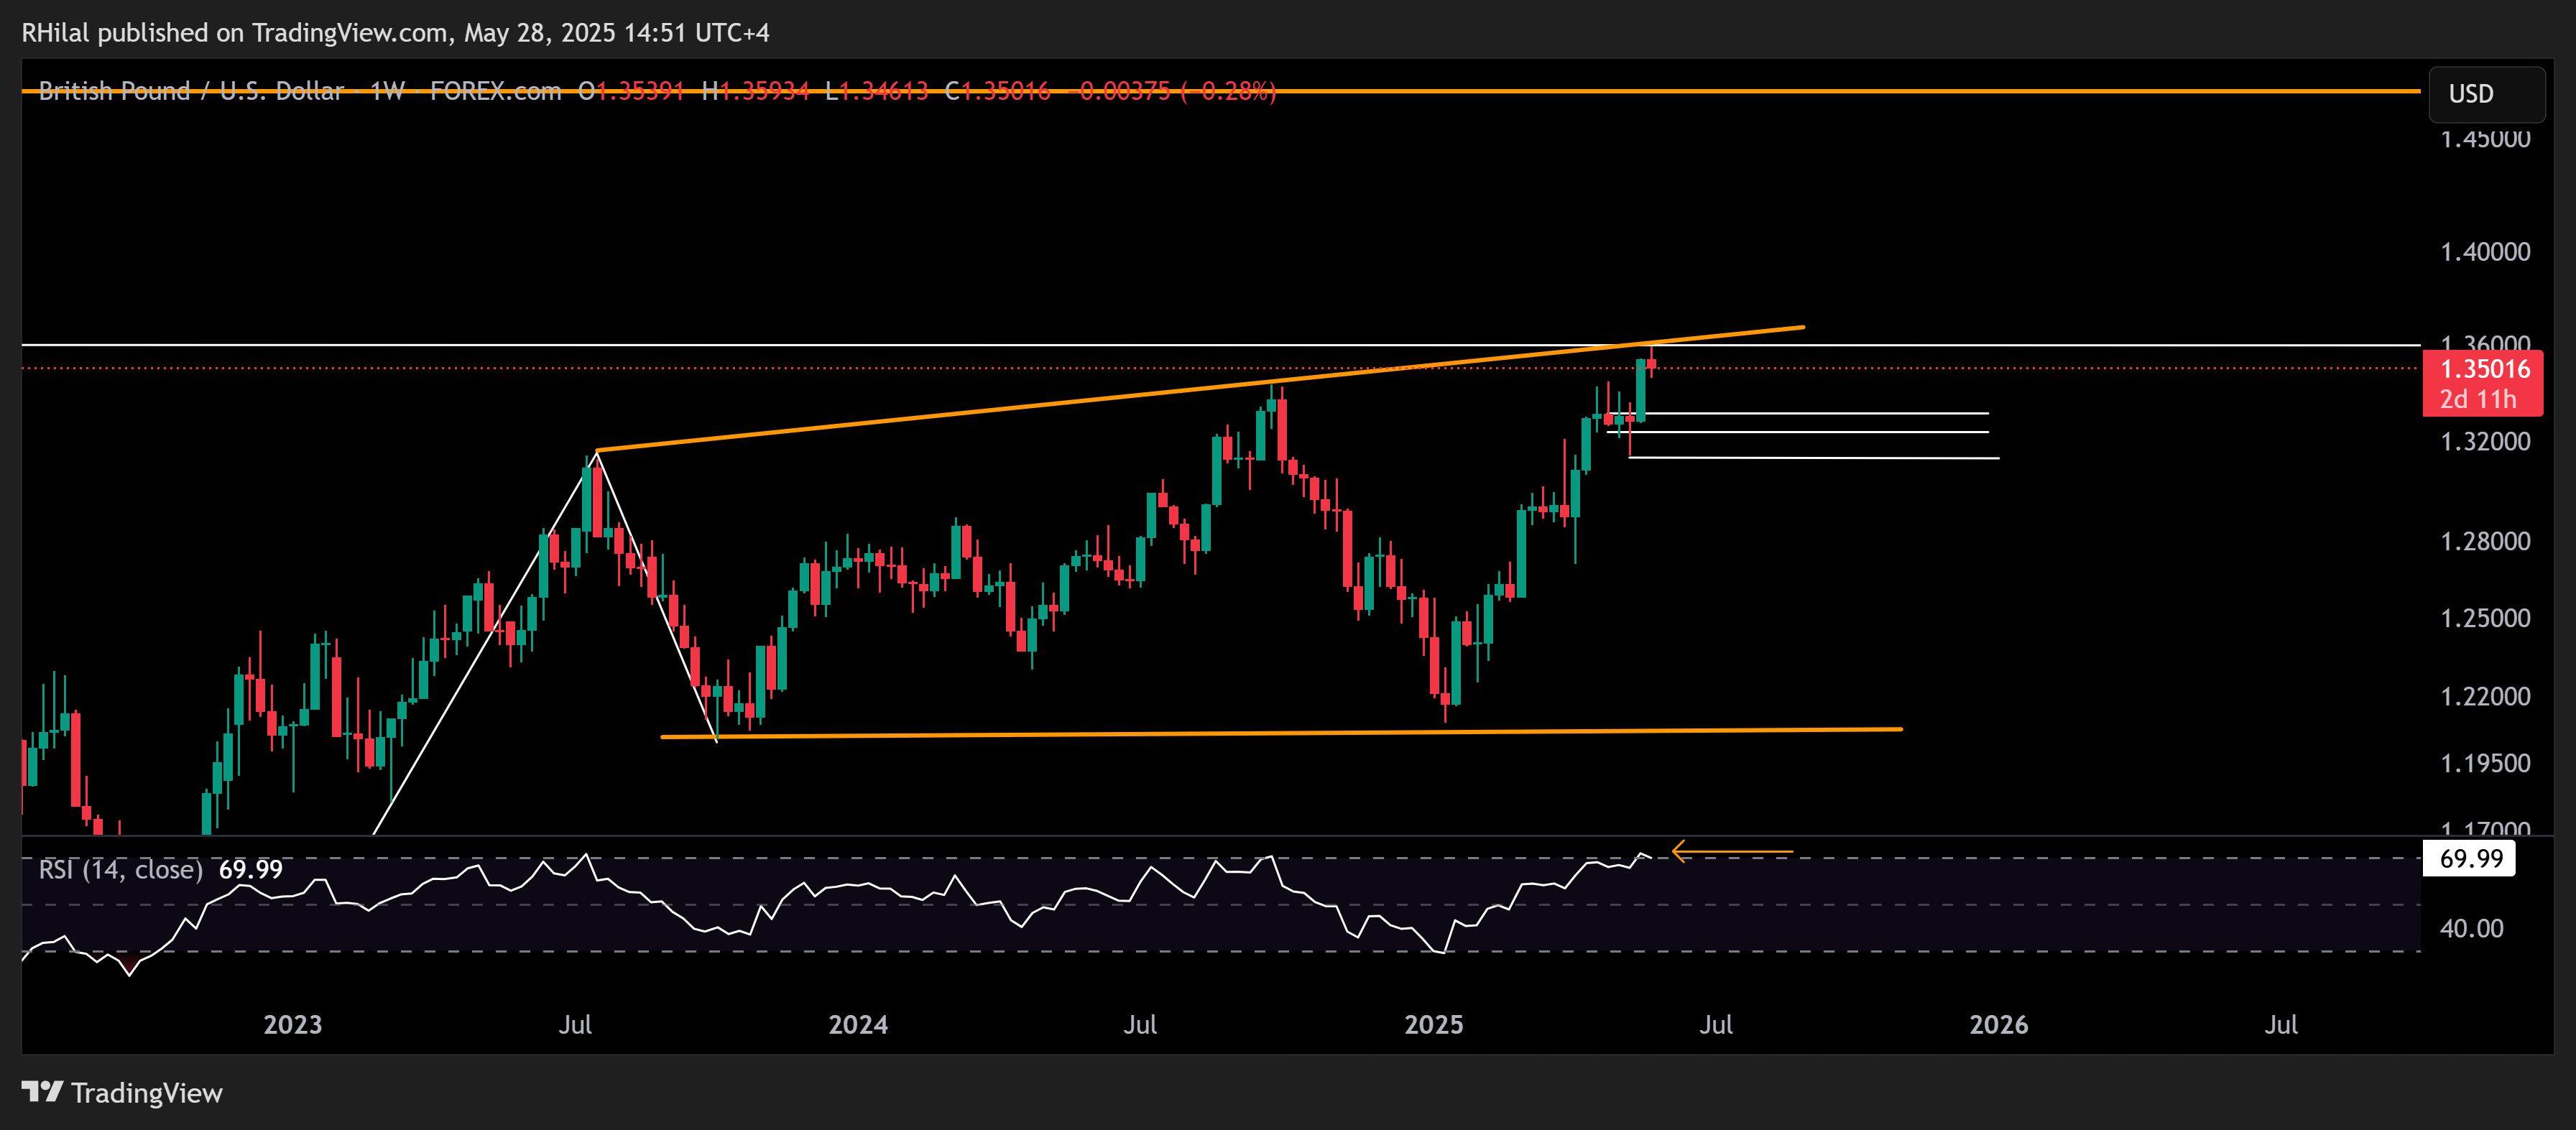
GBPUSD Forecast: Weekly Time Frame – Log Scale
Source: Tradingview
The GBP/USD pair is currently testing a key resistance zone and trendline stretching from the peaks of July 2023 to September 2024. These levels coincide with previously oversold RSI readings seen during the same periods, raising the likelihood of a pullback.
This resistance aligns with the 1.36 level, which also corresponds to the 1.272 Fibonacci extension of the long-term downtrend from the 2008 highs to the 2022 lows. A clean break and sustained move above this level could open the way for further gains, targeting the 0.382 retracement zone and the previous highs from 2021 and 2016, between 1.42 and 1.47.
On the downside, if a pullback emerges—driven by overbought conditions or renewed dollar strength—a clear break below 1.3460 could extend selling pressure toward 1.33, 1.3240, and 1.3140.
Dow Jones Forecast: Weekly Time Frame – Log Scale
Source: Tradingview
The Dow is currently holding near the neckline of a double-top formation that developed between December 2024 and February 2025, possibly buoyed by ongoing tech and Nasdaq optimism. The broader rebound from the 2025 lows is also forming a diagonal structure, setting up the following scenarios:
Bullish Scenario:
With weekly RSI holding above the 50 neutral zone after rebounding from oversold levels last seen in 2020, a sustained move above the 42,400 and 42,800 resistance levels could extend the rally toward 43,800 and 44,800. A breakout above the all-time high near 45,000 would open the door toward the next major resistance at 46,800.
Bearish Scenario:
If the diagonal formation breaks to the downside—below 41,400 and 41,000—selling pressure could resume, forming a diagonal correction targeting support levels at 40,400, 39,700, and 39,000.
Written by Razan Hilal, CMT
Follow on X: @Rh_waves
Related tags:
Latest market news




The complete CFD trading experience
Award-winning platforms, competitive spreads, low commissions and dedicated support.
We live and breathe the markets and are dedicated to helping traders realise their ambitions as we continue to set the industry bar.
Economic calendar
Web Trader platform
Our sophisticated web-based platform is packed with features.
Related articles
AUD/USD hammered by US yields and fading RBA hike bets
US yields, dollar strength and fading RBA hike bets have combined to drive AUD/USD to fresh multi-month lows. The macro and technical bias remains bearish, although history suggests parts of the move are now reaching unusually stretched levels.
EUR/USD Forecast: Euro Struggles to Find Support Even After U.S. PCE Data
The euro continues to face a challenging environment in the short term. The currency has struggled to regain ground against a U.S. dollar that remains firmly supported, a dynamic reflected in EUR/USD, which has now recorded three consecutive losing sessions and a decline of roughly 0.6%.

Canadian Dollar Forecast: USD/CAD Four-Week Rally Eyes Yearly Highs 9 30 2026
USD/CAD has advanced in 14 of the past 15 sessions, but stretched momentum raises the stakes as major resistance and NFP come into focus.

StoneX Europe Ltd may make third party material available on this website which may contain information included but not limited to the conditions of financial markets. The material is for information purposes only and does not contain, and should not be construed as containing, investment advice and/or investment recommendation and/or an investment research and/or an offer of or solicitation for any transactions in financial instruments; any decision to enter into a specific transaction shall be made by the client following an assessment by him/her of their situation.
StoneX Europe Ltd makes no representation or warranty and assumes no liability as to the accuracy or completeness of the information provided, nor any loss arising from any investment based on a recommendation, forecast or other information supplied. You should always seek independent advice as to your suitability to speculate in any related markets and your ability to assume the associated risks, if you are at all unsure. We are not under any obligation to update any such material. Any opinion made may be personal to the author and may not reflect the opinion of StoneX Europe Ltd.