





GBP/USD Reverses Ahead of March Low to Stage Three-Day Rally
GBP/USD reverses ahead of the March low (1.2579) to stage a three-day rally.
Share this:

British Pound Outlook: GBP/USD
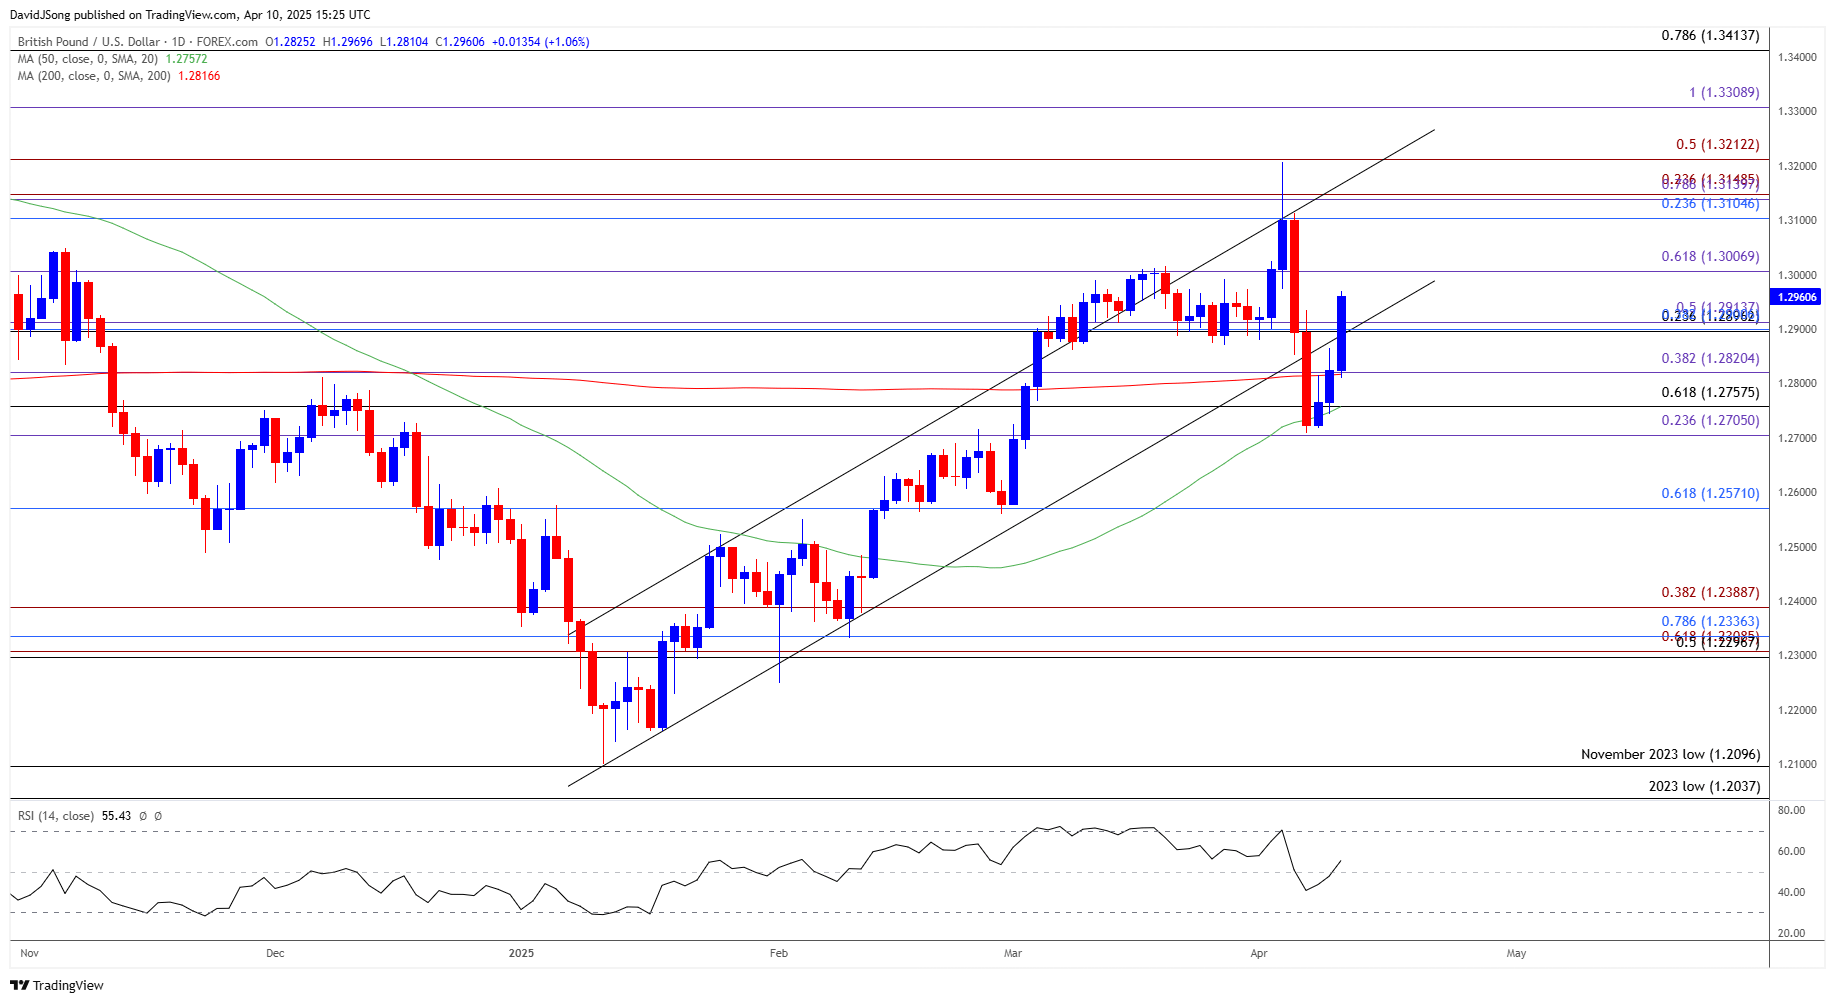
GBP/USD reverses ahead of the March low (1.2579) to stage a three-day rally, and the exchange rate may further retrace the decline from the monthly high (1.3207) as US President Donald Trump pauses the reciprocal tariffs for 90 days.
GBP/USD Reverses Ahead of March Low to Stage Three-Day Rally
GBP/USD extends the rebound from the weekly low (1.2709) as the US Consumer Price Index (CPI) narrows more than expected in March, with the headline reading printing at 2.4% versus forecasts for a 2.6% reading.
Join David Song for the Weekly Fundamental Market Outlook webinar.
David provides a market overview and takes questions in real-time. Register Here
In turn, signs of a slowing US economy may keep GBP/USD afloat as the ongoing shift in trade policy puts pressure on the Federal Reserve to implement lower interest rates, and the exchange rate may continue to track the positive slope in the 50-Day SMA (1.2757) after testing the moving average for the first time since February.
With that said, the British Pound may continue to outperform against its US counterpart as GBP/USD attempts to trade back within the ascending channel from earlier this year, but the rebound in the exchange rate may turn out to be temporary if it struggles to hold above channel support.
GBP/USD Price Chart –Daily
Chart Prepared by David Song, Senior Strategist; GBP/USD on TradingView
- GBP/USD carves a series of higher highs and lows after defending the 1.2710 (23.6% Fibonacci extension) to 1.2760 (61.8% Fibonacci retracement) zone, and a break/close above 1.3000 (61.8% Fibonacci extension) may push the exchange rate back towards the 1.3110 (23.6% Fibonacci retracement) to 1.3150 (23.6% Fibonacci extension) region.
- Next area of interest comes in around the monthly high (1.3207), but lack of momentum to hold/close above the 1.2900 (23.6% Fibonacci retracement) to 1.2910 (50% Fibonacci extension) region may curb the recent series of higher highs and lows in GBP/USD.
- Need a move below 1.2820 (38.2% Fibonacci extension) for GBP/USD to threaten the bullish price series, with the next area of interest coming in around 1.2710 (23.6% Fibonacci extension) to 1.2760 (61.8% Fibonacci retracement).
Additional Market Outlooks
USD/JPY Eyes October Low as China Responds to Trump Tariffs
Canadian Dollar Forecast: USD/CAD Rebound Fizzles amid Trump Tariff Negotiations
AUD/USD Selloff Persists as US Threatens Additional 50% Tariff for China
Euro Forecast: EUR/USD Completes Cup-and-Handle Formation
--- Written by David Song, Senior Strategist
Follow on Twitter at @DavidJSong
Related tags:
Latest market news




The complete CFD trading experience
Award-winning platforms, competitive spreads, low commissions and dedicated support.
We live and breathe the markets and are dedicated to helping traders realise their ambitions as we continue to set the industry bar.
Economic calendar
Web Trader platform
Our sophisticated web-based platform is packed with features.
Related articles
US dollar rally loses yield support as Nvidia looms
US yields are retreating, but the dollar isn't following. With risk aversion potentially keeping it supported, Nvidia's results could determine whether emerging reversal signals in AUD/USD and EUR/USD develop further.
GBP/USD, GBP/JPY, GBP/AUD: Sterling Eyes UK Inflation Catalyst
Sterling faces a pivotal UK inflation test as traders weigh BoE tightening, Fed minutes and Australian employment data across GBP/USD, GBP/JPY and GBP/AUD.

EUR/USD outlook: euro back above 1.1000 as dollar rally loses steam
EUR/USD has recovered back above 1.1000 after a brief break lower, a sign the dollar's inflation-driven rally may be losing momentum. With a December Fed hike largely priced in and oil a potential tailwind for the euro, the risks are starting to tilt to the upside.

StoneX Europe Ltd may make third party material available on this website which may contain information included but not limited to the conditions of financial markets. The material is for information purposes only and does not contain, and should not be construed as containing, investment advice and/or investment recommendation and/or an investment research and/or an offer of or solicitation for any transactions in financial instruments; any decision to enter into a specific transaction shall be made by the client following an assessment by him/her of their situation.
StoneX Europe Ltd makes no representation or warranty and assumes no liability as to the accuracy or completeness of the information provided, nor any loss arising from any investment based on a recommendation, forecast or other information supplied. You should always seek independent advice as to your suitability to speculate in any related markets and your ability to assume the associated risks, if you are at all unsure. We are not under any obligation to update any such material. Any opinion made may be personal to the author and may not reflect the opinion of StoneX Europe Ltd.