






Gold Needs to Reverse Soon if It is Going Higher
If gold breaks below 1445, stocks may move higher because of the inverse correlation.
Share this:

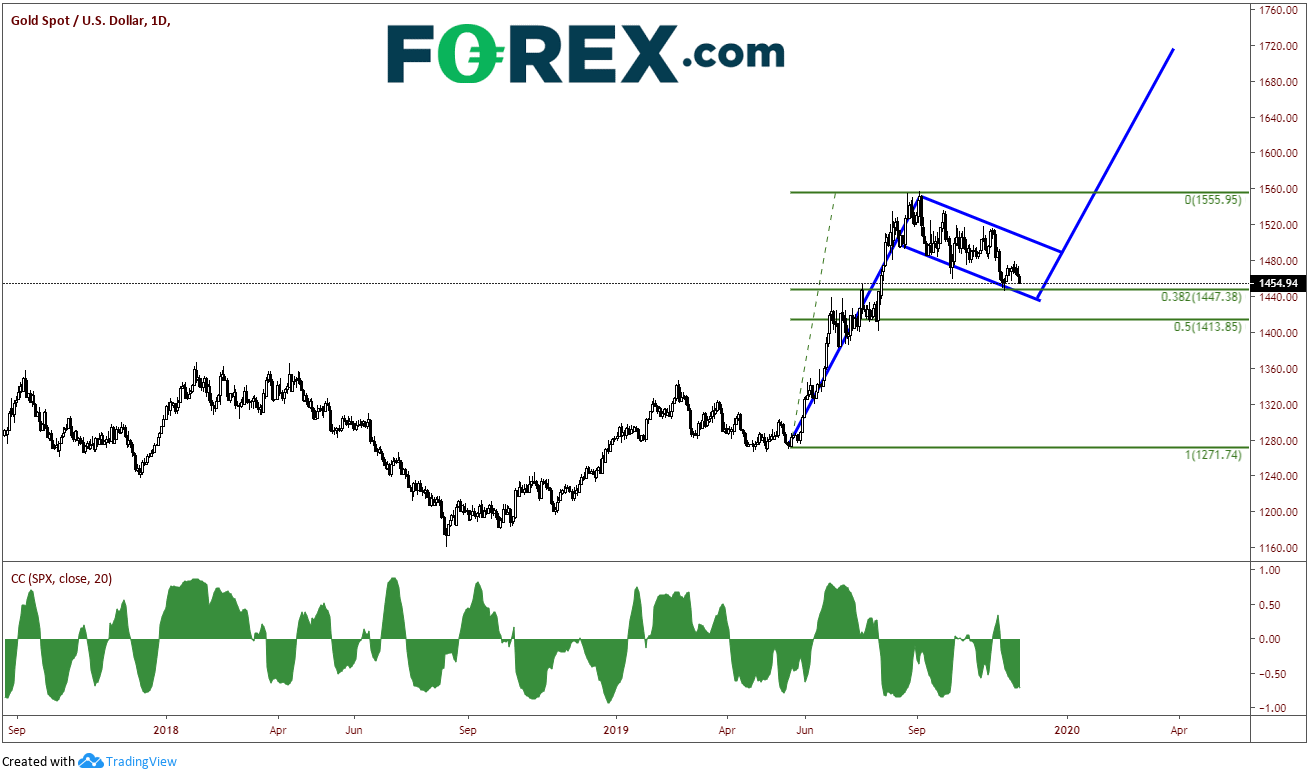
Gold and the stock market are considered traditionally to be inversely related. When prices of stocks go down, the price of gold moves higher, and vice versa. That is indeed the case today as we can see on the correlation coefficient oscillator at the bottom of the chart on a daily timeframe. The correlation coefficient is currently -.68. (For reference, a correlation coefficient of -1.00 means that the two assets move in opposite directions 100% of the time.). As stocks continue to put in new all-time highs, gold has been pulling back.
Source: Tradingview, City Index
The price of gold in the spot market is near 1455. On September 3rd, it traded as high as 1555.76 before pulling back in a flag like formation. Price is near strong support at 1445. This level represents horizontal support, trendline support from the bottom of the flag, and it is the 38.2% Fibonacci retracement level from the lows in late April to the highs on September 3rd. If price closes below 1445 on a daily timeframe, it may be likely to travel down towards 1410.75, which is the 50% retracement level of the previously mentioned timeframe. If gold does break below 1445, stocks are likely to move higher because of the inverse correlation.
If the price of gold holds the 1445 level and begins moving higher, it could trade out of the flag formation. The target for the flag is near 1715. However, on the way to the target price, must first break through the top of the flag near 1490. The next resistance level is the highs of September 3rd at 1555, which is also near horizontal resistance from 2011-2013. If the target is achieved, the next level is near 1797, which is a triple top and old support, also from 2011-2013.
Source: Tradingview, City Index
However, just remember that if gold trades up to those levels, stocks theoretically will be much lower.
Gold and the stock market are considered traditionally to be inversely related. When prices of stocks go down, the price of gold moves higher, and vice versa. That is indeed the case today as we can see on the correlation coefficient oscillator at the bottom of the chart on a daily timeframe. The correlation coefficient is currently -.68. (For reference, a correlation coefficient of -1.00 means that the two assets move in opposite directions 100% of the time.). As stocks continue to put in new all-time highs, gold has been pulling back.
Source: Tradingview, FOREX.com
The price of gold in the spot market is near 1455. On September 3rd, it traded as high as 1555.76 before pulling back in a flag like formation. Price is near strong support at 1445. This level represents horizontal support, trendline support from the bottom of the flag, and it is the 38.2% Fibonacci retracement level from the lows in late April to the highs on September 3rd. If price closes below 1445 on a daily timeframe, it may be likely to travel down towards 1410.75, which is the 50% retracement level of the previously mentioned timeframe. If gold does break below 1445, stocks are likely to move higher because of the inverse correlation.
If the price of gold holds the 1445 level and begins moving higher, it could trade out of the flag formation. The target for the flag is near 1715. However, on the way to the target price, must first break through the top of the flag near 1490. The next resistance level is the highs of September 3rd at 1555, which is also near horizontal resistance from 2011-2013. If the target is achieved, the next level is near 1797, which is a triple top and old support, also from 2011-2013.
Source: Tradingview, FOREX.com
However, just remember that if gold trades up to those levels, stocks theoretically will be much lower.
Related tags:
Latest market news




The complete CFD trading experience
Award-winning platforms, competitive spreads, low commissions and dedicated support.
We live and breathe the markets and are dedicated to helping traders realise their ambitions as we continue to set the industry bar.
Economic calendar
Web Trader platform
Our sophisticated web-based platform is packed with features.
Related articles
GBP/USD forecast: US dollar surges as bonds implode
The US dollar continued to press higher deep into the European session, supported by the slump in the bond markets as yields broke out across the curve. Following the recent hawkish Fed rate hike, yield spreads between the US and the rest of the world has continually increased, and that motion continued today, helped in part by some forecast-beating US macro data and hawkish Fed commentary.
Gold Analysis: Rising Yields and Dollar Strength Weigh on XAU/USD
The trading week continues, and for now gold remains under notable pressure in the short term. This can be seen in the performance of XAU/USD over the last three trading sessions, where the metal has declined by more than 2.00%, bringing a bearish bias back into focus after it had lost momentum in recent weeks.

Australian Dollar Technical Outlook: AUD/USD Breakdown Threatens Deeper Correction 9 23 2026
AUD/USD remains under pressure after breaking key trend support, with the latest decline putting the focus on the next major downside pivot.

StoneX Europe Ltd may make third party material available on this website which may contain information included but not limited to the conditions of financial markets. The material is for information purposes only and does not contain, and should not be construed as containing, investment advice and/or investment recommendation and/or an investment research and/or an offer of or solicitation for any transactions in financial instruments; any decision to enter into a specific transaction shall be made by the client following an assessment by him/her of their situation.
StoneX Europe Ltd makes no representation or warranty and assumes no liability as to the accuracy or completeness of the information provided, nor any loss arising from any investment based on a recommendation, forecast or other information supplied. You should always seek independent advice as to your suitability to speculate in any related markets and your ability to assume the associated risks, if you are at all unsure. We are not under any obligation to update any such material. Any opinion made may be personal to the author and may not reflect the opinion of StoneX Europe Ltd.