



Gold Outlook: Rising Implied Volatility on Path to $4000
Gold eyes $4,000 as implied volatility climbs, COT positioning strengthens, and technical signals confirm bullish momentum.
Share this:

Gold futures are charging toward the $4,000 milestone, backed by firm bullish positioning, rising implied volatility, and strong technical momentum. While sentiment remains supportive, traders are also hedging with downside protection, hinting at heightened swings as prices press higher. With positioning, volatility, and technicals aligning, gold’s rally remains intact — but traders should be alert for shakeouts as $4,000 comes into view.
View related analysis:
View related analysis:
Gold Outlook: Positioning, Volatility, and Technicals in Focus
Gold Futures Positioning (GC): Weekly COT Report Analysis
Market positioning in gold futures remains notable as traders show no signs of reaching a sentiment extreme despite surging prices. The latest Commitment of Traders (COT) report reveals that net-long exposure is trending higher among large speculators and managed funds, though still not at historically stretched levels. Gross-longs continue to climb while shorts remain relatively low, although there has been a slight uptick in gross-short exposure in recent weeks.
With the trend firmly higher and net-long positioning gradually increasing, $4,000 appears to be the next logical upside target. Dip buyers are likely to remain active, stepping in to capitalise on pullbacks.
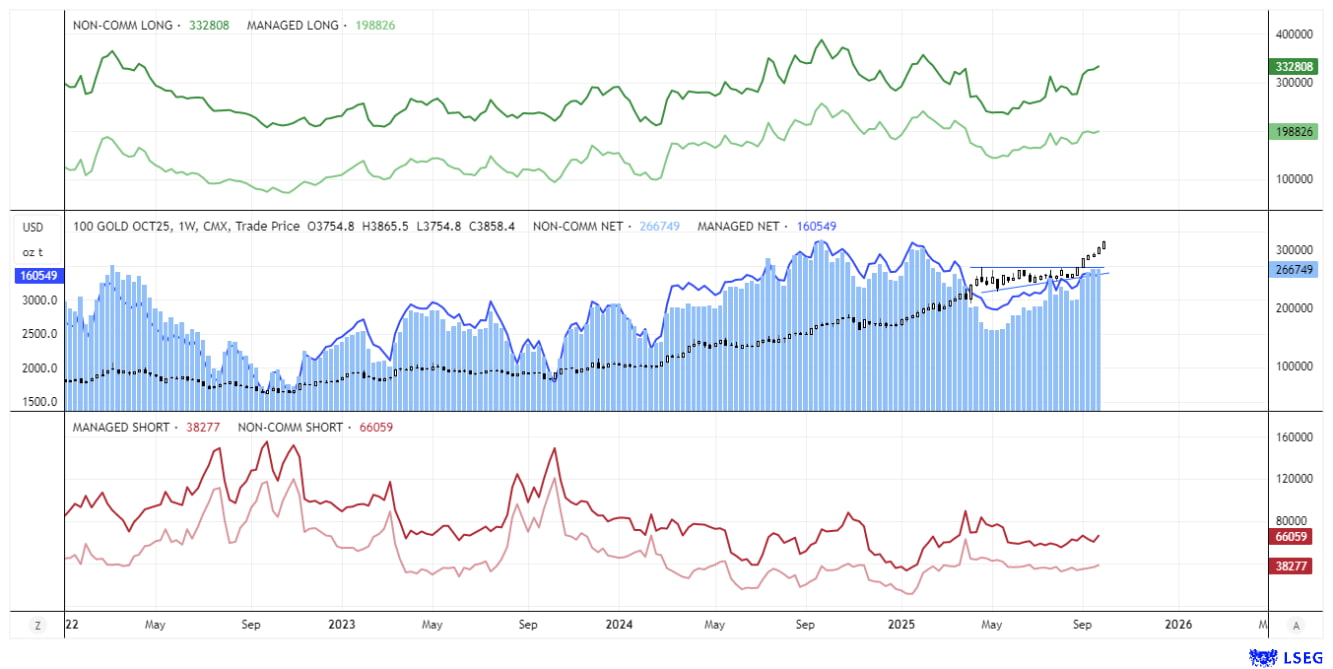
Chart analysis by Matt Simpson, Source: COMEX Futures, LSEG


Gold Implied Volatility and Risk Reversals
Gold’s implied volatility has climbed in recent weeks, with 1-month annualised IV hitting a three-month high of 17.3 on Friday, while 1-week IV rose to a two-week high at 16.04. This suggests traders may be preparing for further price swings as gold approaches the key $4,000 level.
At the same time, risk-reversals have tilted lower, signalling increased demand for puts relative to calls – a sign that traders are hedging against downside risks despite the strong bullish trend.

Chart analysis by Matt Simpson, Source: COMEX Futures, LSEG
Gold Futures (GC) Technical Analysis
The daily chart shows gold tracking along the 10-day EMA and now trading just over $100 below the $4,000 milestone. The RSI (14) is firmly in overbought territory – exactly where it should be during such a strong rally. Even so, a long-legged doji formed yesterday, hinting at some hesitation to push higher.
On Tuesday, gold saw a sharp selloff around the European open, with rising volumes suggesting bearish initiation. However, buying pressure quickly regained control during the US session, and prices have since pushed to fresh highs in Asia. The cumulative volume delta (CVD) has also reached new highs, confirming strong demand.
The takeaway is that buyers remain eager to step in on even minor dips. While gold bulls appear determined to test $4,000, traders should brace for heightened volatility as that level nears – and the potential for a shakeout if prices tag the milestone.

Chart analysis by Matt Simpson, Source: TradingView, COMEX Futures, Gold
View the full economic calendar
View the full economic calendar
-- Written by Matt Simpson
Follow Matt on Twitter @cLeverEdge
How to trade with City Index
You can trade with City Index by following these four easy steps:
- Open an account, or log in if you’re already a customer
• Open an account in the UK
• Open an account in Australia
• Open an account in Singapore
- Search for the market you want to trade in our award-winning platform
- Choose your position and size, and your stop and limit levels
- Place the trade
Related tags:
Latest market news




The complete CFD trading experience
Award-winning platforms, competitive spreads, low commissions and dedicated support.
We live and breathe the markets and are dedicated to helping traders realise their ambitions as we continue to set the industry bar.
Economic calendar
Web Trader platform
Our sophisticated web-based platform is packed with features.
Related articles

Gold Price Short-term Outlook: XAU/USD Holds Critical Support as Breakout Nears 10 15 2026
Gold is consolidating after a steep selloff, with momentum divergence raising the stakes for the next move ahead of the Fed decision.

Gold outlook: Metal rebounds but downside risks persist
For now, at least, my near-term gold outlook remains modestly bearish, even if I have a strong long-term bullish bias towards gold and especially silver.


GBP/USD, Gold Forecasts: Two trades to watch
GBP/USD rises after UK GDP boost and amid a weaker USD. Gold rises as Treasury yields and USD ease lower. PPI and retail sales data are up next.

StoneX Europe Ltd may make third party material available on this website which may contain information included but not limited to the conditions of financial markets. The material is for information purposes only and does not contain, and should not be construed as containing, investment advice and/or investment recommendation and/or an investment research and/or an offer of or solicitation for any transactions in financial instruments; any decision to enter into a specific transaction shall be made by the client following an assessment by him/her of their situation.
StoneX Europe Ltd makes no representation or warranty and assumes no liability as to the accuracy or completeness of the information provided, nor any loss arising from any investment based on a recommendation, forecast or other information supplied. You should always seek independent advice as to your suitability to speculate in any related markets and your ability to assume the associated risks, if you are at all unsure. We are not under any obligation to update any such material. Any opinion made may be personal to the author and may not reflect the opinion of StoneX Europe Ltd.