






Gold’s probe above $2000 may determine its longer-term trajectory
With the US dollar index falling through its 200-day moving average while benchmark US bond yields remain contained, it should come as no surprise that gold has pushed back towards $2000 per ounce over the past few days.
Share this:

- Gold is back knocking on the door of $2000, a level it has struggled to overcome in recent months
- Bond yields appear capped near-term, but the USD outlook appears less certain
- Whichever way gold breaks may determine which trajectory it takes heading into 2024
With the US dollar index falling through its 200-day moving average while benchmark US bond yields remain contained, it should come as no surprise that gold has pushed back towards $2000 per ounce over the past few days. With decent resistance parked just above this level, you could argue that what happens in the near-term could easily dictate how gold fares heading into 2024.
Gold’s two market adversaries have been weakening
When you look at the two main drivers of the gold price – the US dollar and real bond yields – it’s clear the unwind in both this week has benefitted bullion recently. As seen in the chart below, the US dollar index has skidded over 3.5% since the beginning of November, seeing it fall through its 200-day moving average for the first time in over a year.
Source: Refinitiv
Softer US data is lowering bond yields and dollar
The weakness in the US dollar is partly in response to a softening in US economic data which has led to a softening in tone from Fed officials towards the interest rate outlook, seeing markets move to price in earlier and larger rate cuts in 2024 which has subsequently acted to drag down Treasury yields further out the US interest rate curve.
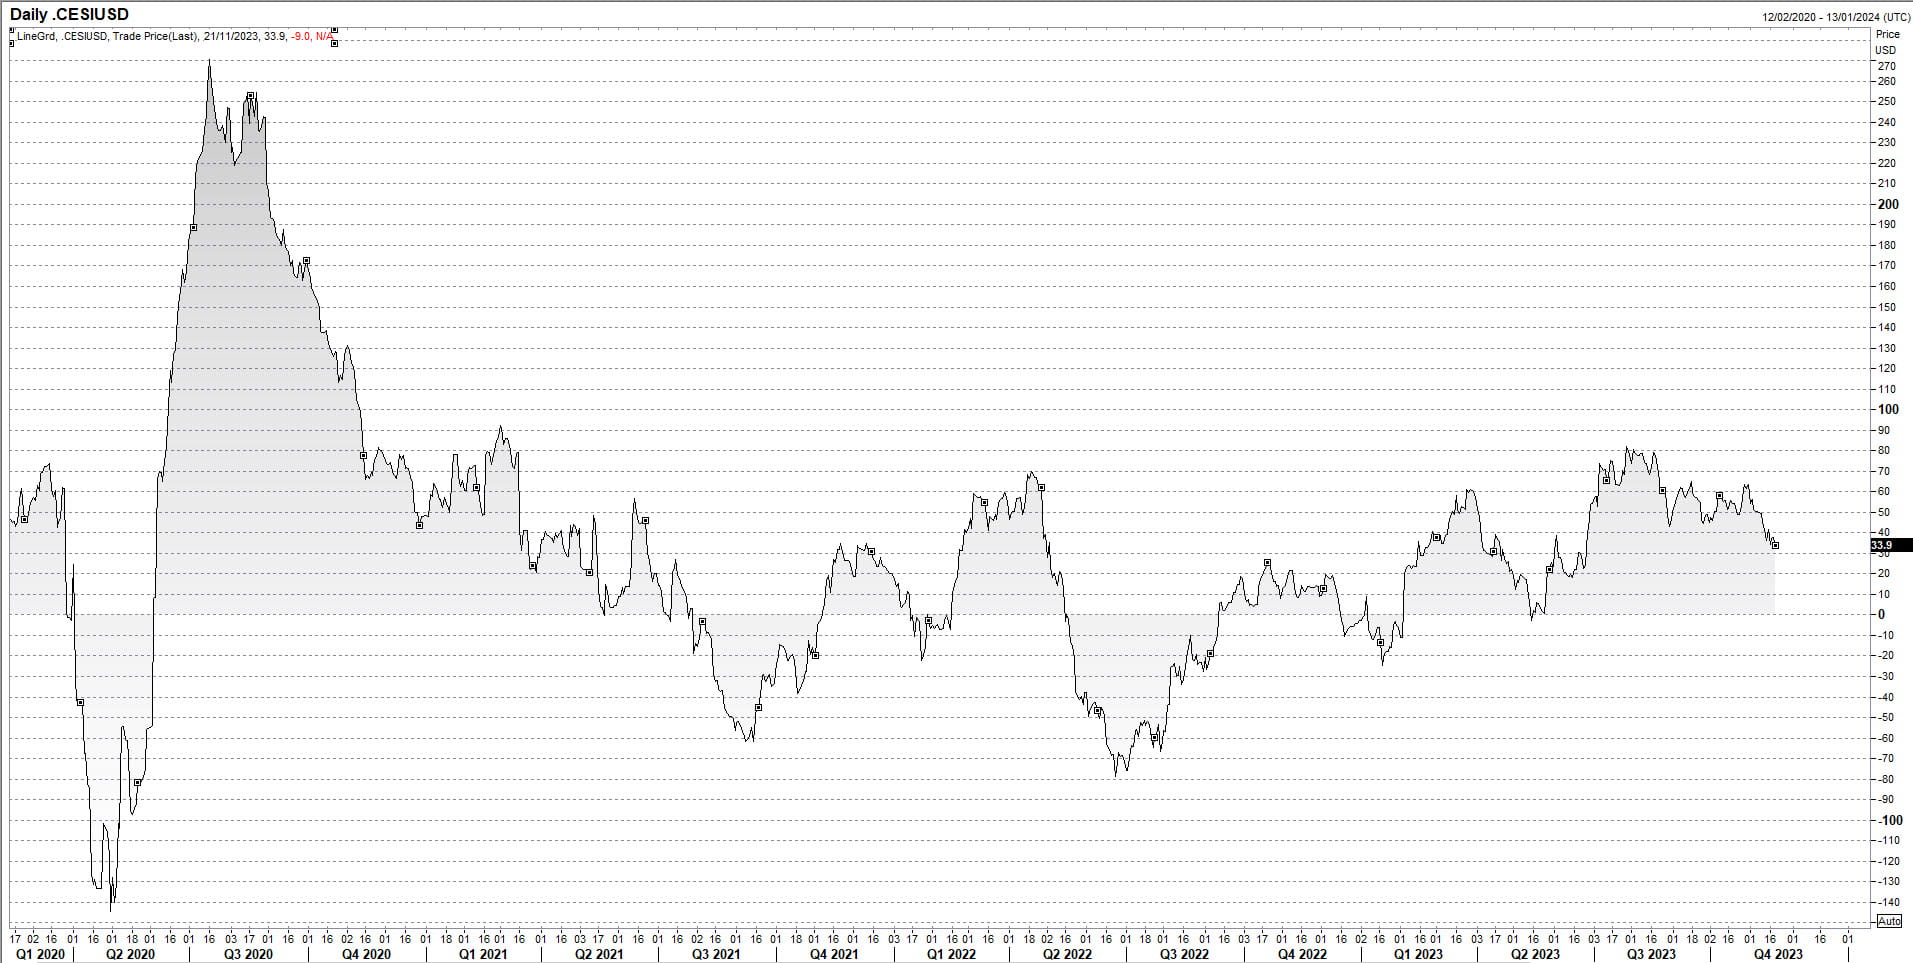
Here’s Citi’s US economic surprise index showing that while most indicators continue to beat expectations, the proportion is down from levels seen earlier this year.
Source: Refinitiv
That’s seen the US secured overnight financing rate (SOFR) curve – which is often used as proxy for where the Fed funds rate may sit in the future – move to price in around 100 basis points of rate cuts in 2024.
Source: Refinitiv
With US inflation expectations subsiding as price pressures have rolled over, the rally at the front-end of the US yield curve has seen nominal and real US bond yields pare their advance this year, as seen in the chart below of 10-year real yields.
Source: Refinitiv
Yields look contained but the US dollar could be problematic
For a zero-yielding asset priced predominantly in US dollar terms, recent developments in FX and bond markets have been beneficial for gold. But will this placid environment stick around beyond the short-term, potentially allowing the gold price to retest the record highs set earlier this year?
On the bond side of the equation, signs of cooling in the US labour market, combined with a decent 20-year Treasury auction result earlier this week, suggests yields are unlikely to spike aggressively higher in the near-term. Given current stretched short positioning, you could easily argue the path of least resistance remains lower.
But on the dollar side of the equation, the outlook is less clear despite the DXY falling through its 200-day moving average. With euro and Japanese yen hardly sending off bullish vibes when it comes to the macro outlook, the two main weightings in the US dollar index may struggle for upside beyond that already seen. And if the global economy really starts to turn, it may benefit the dollar by spurring capital flows linked to risk aversion.
While geopolitics and black swan events could easily change the picture, it’s the lack of meaningful evidence that dollar weakness will be sustained that hints upside for gold may be hard won from here.
Another failure above $2000 will embolden gold bears
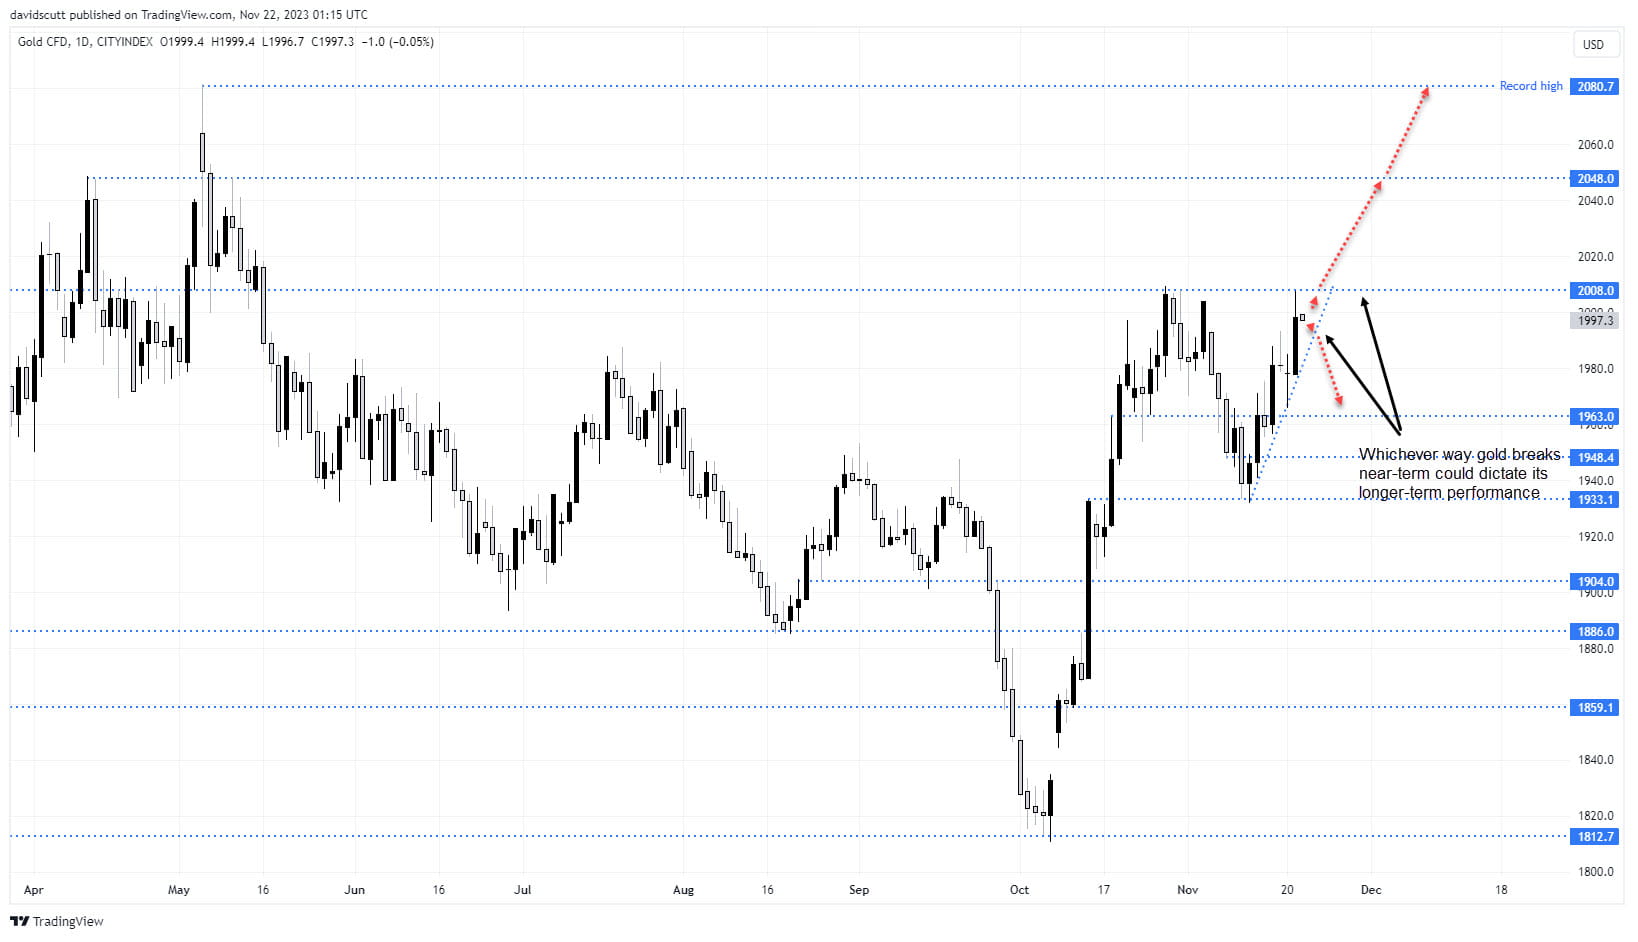
Looking at the daily chart, it may pay to wait for either a break of uptrend support dating back to mid-November or strong horizontal resistance at $2008, rather than pre-empting. After multiple failures above $2000, another would only strengthen the case for a more pronounced pullback beyond that seen earlier this month. Alternatively, if we do see resistance crack, it will naturally get traders thinking about the potential for a push towards and perhaps beyond the prior record highs.
-- Written by David Scutt
Follow David on Twitter @scutty
How to trade with City Index
You can trade with City Index by following these four easy steps:
- Open an account, or log in if you’re already a customer
• Open an account in the UK
• Open an account in Australia
• Open an account in Singapore
- Search for the market you want to trade in our award-winning platform
- Choose your position and size, and your stop and limit levels
- Place the trade
Related tags:
Latest market news



The complete CFD trading experience
Award-winning platforms, competitive spreads, low commissions and dedicated support.
We live and breathe the markets and are dedicated to helping traders realise their ambitions as we continue to set the industry bar.
Economic calendar
Web Trader platform
Our sophisticated web-based platform is packed with features.
Related articles

USD/JPY Q4 2026 Outlook: Hawkish Fed Pricing Clashes With Intervention Risk
The year-end tug-of-war is clear: hawkish Fed pricing supports USD/JPY, while intervention risk limits the upside.

Gold, silver slammed as hawkish Fed repricing reignites dollar upside
Gold and silver had held up surprisingly well against surging US yields. Wednesday’s DXY breakout may have changed that equation.

GBP/USD forecast: US dollar surges as bonds implode
The US dollar continued to press higher deep into the European session, supported by the slump in the bond markets as yields broke out across the curve. Following the recent hawkish Fed rate hike, yield spreads between the US and the rest of the world has continually increased, and that motion continued today, helped in part by some forecast-beating US macro data and hawkish Fed commentary.
StoneX Europe Ltd may make third party material available on this website which may contain information included but not limited to the conditions of financial markets. The material is for information purposes only and does not contain, and should not be construed as containing, investment advice and/or investment recommendation and/or an investment research and/or an offer of or solicitation for any transactions in financial instruments; any decision to enter into a specific transaction shall be made by the client following an assessment by him/her of their situation.
StoneX Europe Ltd makes no representation or warranty and assumes no liability as to the accuracy or completeness of the information provided, nor any loss arising from any investment based on a recommendation, forecast or other information supplied. You should always seek independent advice as to your suitability to speculate in any related markets and your ability to assume the associated risks, if you are at all unsure. We are not under any obligation to update any such material. Any opinion made may be personal to the author and may not reflect the opinion of StoneX Europe Ltd.