






Insatiable Appetite for US Dollars
The US Dollar is in high demand as markets around the world are sold
Share this:

The US Dollar is in high demand as markets around the world are sold and investors are searching for a place to park their money, which has pushed the DXY 2.5% higher on the day, to 101.74. Yesterdays close was 99.50! DXY is up 3% this month so far, while the range for the month is 6%. Why is the US Dollar so bid? In addition to demand from the flight to safety trade, banks are reluctant to lend cash to low creditworthy firms and foreign banks. They are also concerned that small businesses may not be able to may back loans. In addition, the companies that do have strong ratings are drawing on their lines of credit to raise cash. These are all contributing to the demand for US Dollars. Due to this strong demand, the Federal Reserve is taking unprecedented actions to make sure the supply is there when it’s needed. Some of these actions include slashing interest rates to 0% (from 1.75% in January) and increasing participation in the overnight commercial paper market, which firms use to fund day to day operations.
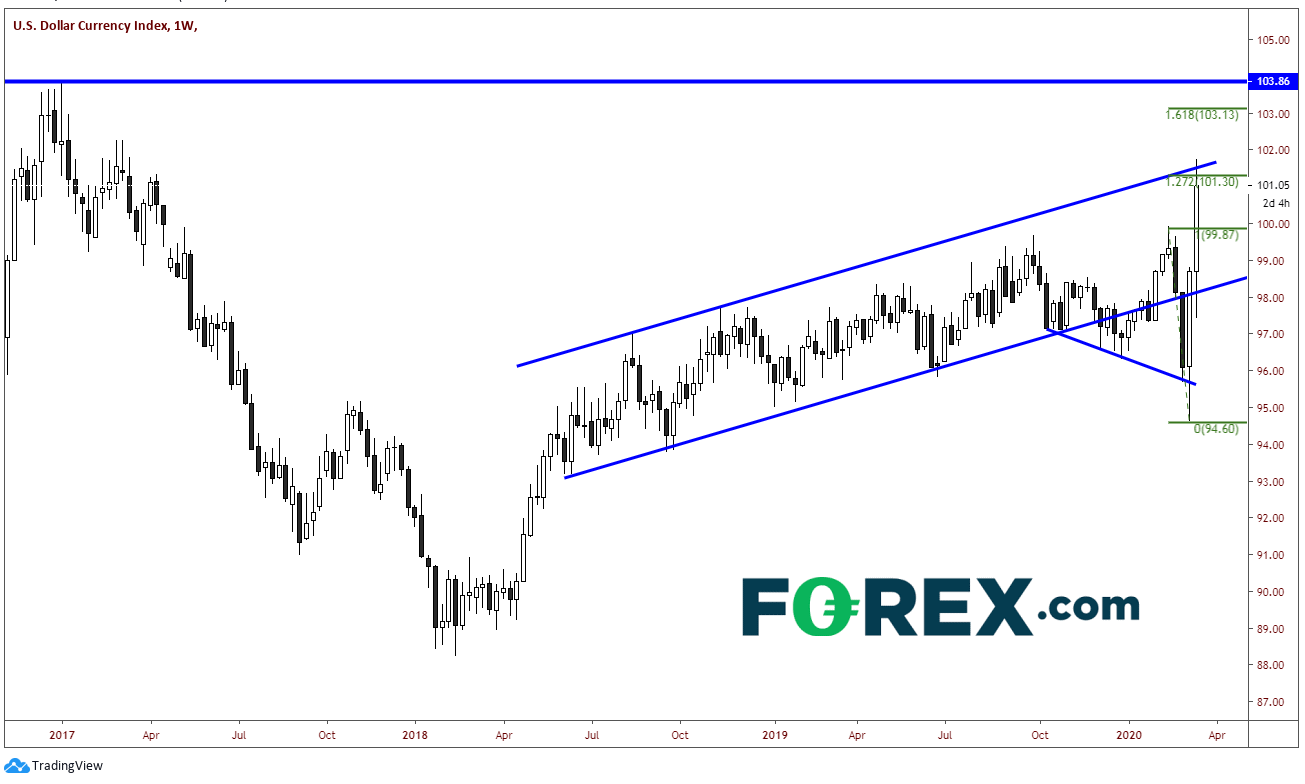
In order to find resistance for the DXY, we must look at a weekly chart. The US Dollar is currently trading at the 127.2% Fibonacci extension from the mid-February highs to last week’s lows near 101.30. There is also channel resistance dating back to May 2018 near 101.50. Price has spiked through both those levels today, therefore, today’s highs of 101.74 now become resistance. Above that is 103.86, which is the high in early 2017. Support is 99.90!
Source: Tradingview, City Index
Take note of the average true range (ATR) on a daily timeframe. The true range is the greatest of the current high less the current low, the absolute value of the current high less the previous close, and the absolute value of the current low less the previous close. Therefore, the ATR is a moving average, usually using 14 days, of true ranges. (Investopedia). From the beginning of 2019 until February 20th, 2020, the ATR has been roughly between 30 and 50 pips for the DXY. On February 20th, it was .34, or 34 pips. The ATR began to rise and is currently 1.06, or 106 pips. The average true range for the DXY has tripled over the last month!
Source: Tradingview, City Index
This is important because traders need to compensate for the volatility in their trading. One way to do this is for traders to decrease the “size” of their trades to 1/3 of their normal trading size. This will give traders the same risk/reward as if volatility was between the 30 and 50 pips before February 20th.
You will see this type of action in the ATR of other instruments as well. Trade safe. Account preservation is paramount!
The US Dollar is in high demand as markets around the world are sold and investors are searching for a place to park their money, which has pushed the DXY 2.5% higher on the day, to 101.74. Yesterdays close was 99.50! DXY is up 3% this month so far, while the range for the month is 6%. Why is the US Dollar so bid? In addition to demand from the flight to safety trade, banks are reluctant to lend cash to low creditworthy firms and foreign banks. They are also concerned that small businesses may not be able to may back loans. In addition, the companies that do have strong ratings are drawing on their lines of credit to raise cash. These are all contributing to the demand for US Dollars. Due to this strong demand, the Federal Reserve is taking unprecedented actions to make sure the supply is there when it’s needed. Some of these actions include slashing interest rates to 0% (from 1.75% in January) and increasing participation in the overnight commercial paper market, which firms use to fund day to day operations.
In order to find resistance for the DXY, we must look at a weekly chart. The US Dollar is currently trading at the 127.2% Fibonacci extension from the mid-February highs to last week’s lows near 101.30. There is also channel resistance dating back to May 2018 near 101.50. Price has spiked through both those levels today, therefore, today’s highs of 101.74 now become resistance. Above that is 103.86, which is the high in early 2017. Support is 99.90!
Source: Tradingview, FOREX.com
Take note of the average true range (ATR) on a daily timeframe. The true range is the greatest of the current high less the current low, the absolute value of the current high less the previous close, and the absolute value of the current low less the previous close. Therefore, the ATR is a moving average, usually using 14 days, of true ranges. (Investopedia). From the beginning of 2019 until February 20th, 2020, the ATR has been roughly between 30 and 50 pips for the DXY. On February 20th, it was .34, or 34 pips. The ATR began to rise and is currently 1.06, or 106 pips. The average true range for the DXY has tripled over the last month!
Source: Tradingview, FOREX.com
This is important because traders need to compensate for the volatility in their trading. One way to do this is for traders to decrease the “size” of their trades to 1/3 of their normal trading size. This will give traders the same risk/reward as if volatility was between the 30 and 50 pips before February 20th.
You will see this type of action in the ATR of other instruments as well. Trade safe. Account preservation is paramount!
Latest market news




The complete CFD trading experience
Award-winning platforms, competitive spreads, low commissions and dedicated support.
We live and breathe the markets and are dedicated to helping traders realise their ambitions as we continue to set the industry bar.
Economic calendar
Web Trader platform
Our sophisticated web-based platform is packed with features.
Related articles

USD/JPY Q4 2026 Outlook: Hawkish Fed Pricing Clashes With Intervention Risk
The year-end tug-of-war is clear: hawkish Fed pricing supports USD/JPY, while intervention risk limits the upside.


USD/CAD and USD/MXN Q4 2026 Outlook: Will the U.S. Dollar Dominate North America Again?
The final stretch of 2026 is approaching, and North America's major currencies have begun to show a shift in the strength dynamics seen earlier in the year. New expectations of a more aggressive monetary policy stance, particularly in the United States, could be significantly reshaping the outlook for the region. At the same time, this backdrop, combined with potential trade tensions across North America, may become one of the most important drivers of currency performance in the months ahead.


Gold Analysis: Rising Yields and Dollar Strength Weigh on XAU/USD
The trading week continues, and for now gold remains under notable pressure in the short term. This can be seen in the performance of XAU/USD over the last three trading sessions, where the metal has declined by more than 2.00%, bringing a bearish bias back into focus after it had lost momentum in recent weeks.
StoneX Europe Ltd may make third party material available on this website which may contain information included but not limited to the conditions of financial markets. The material is for information purposes only and does not contain, and should not be construed as containing, investment advice and/or investment recommendation and/or an investment research and/or an offer of or solicitation for any transactions in financial instruments; any decision to enter into a specific transaction shall be made by the client following an assessment by him/her of their situation.
StoneX Europe Ltd makes no representation or warranty and assumes no liability as to the accuracy or completeness of the information provided, nor any loss arising from any investment based on a recommendation, forecast or other information supplied. You should always seek independent advice as to your suitability to speculate in any related markets and your ability to assume the associated risks, if you are at all unsure. We are not under any obligation to update any such material. Any opinion made may be personal to the author and may not reflect the opinion of StoneX Europe Ltd.