



Is the Hang Seng Coiling its way to a breakout?
Looking across several timeframes suggest that the Hang Seng is moving towards a larger move, whilst prices coil on lower timeframes.
Share this:

Looking across several timeframes suggest that the Hang Seng is moving towards a larger move, whilst prices coil on lower timeframes.
Hang Seng Index (monthly chart):
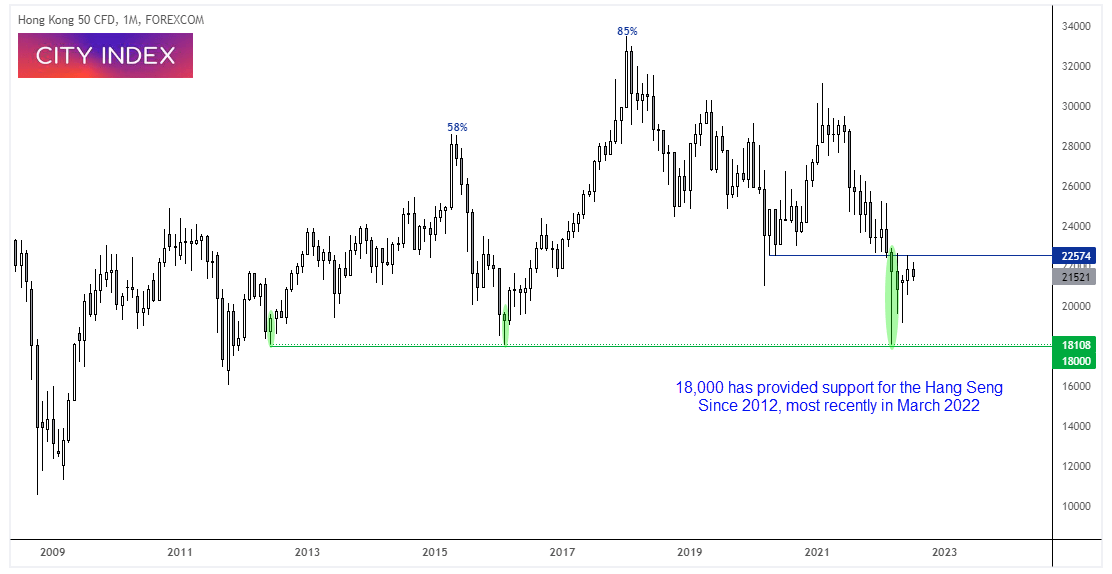
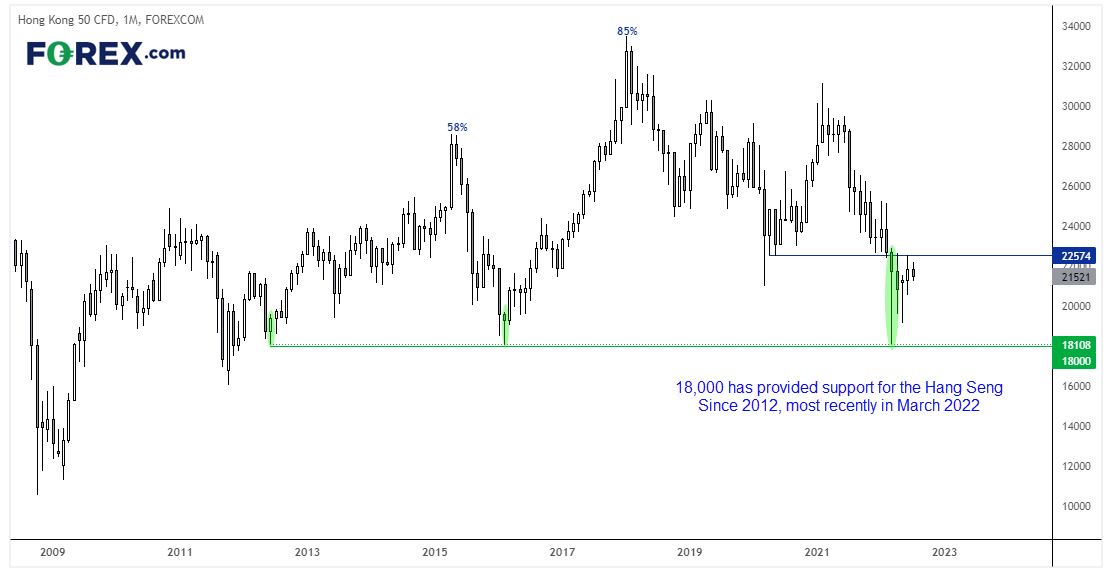
We can see on the monthly chart that 18,000 has provided support since 2012, with the most recent low forming in March this year. The market rallied around 58% from the 2012 low and 85% from the 2016 low.
At this stage we do not know if this is a multi-year bullish continuation, or reversal pattern. If this is part of a head and shoulders top, we could assume that a break above 22,600 may top out below 28,650 (the left shoulders or 58% rally).
But if prices remain below 22,600 then we will be looking for a potential break below 18,000 to mark a major reversal. As this is the monthly chart we have time on our side.
Hang Seng Index (weekly chart):
When looking for a high conviction for potential direction, we’d prefer to see multiple timeframes align for the analysis. Yet that’s not what we are seeing on the weekly chart. Whilst the Hang Seng has printed a higher low from 18,000, it has met resistance at 22,574 support and a bearish trendline. A bearish hammer formed at this key level last week and the market is back below 22,000. The stochastic oscillator also shows the potential to provide a sell signal, so perhaps the Hang Seng to dip lower on the weekly chart.
Perhaps we may see the market coil between the two trendlines until a sustained move is seen in either direction. Ultimately we need to see a break above 22,600 to confirm the next leg higher, whilst a break of the lower trendline suggests momentum has realigned with the bearish trendline.


Hang Seng (daily chart):
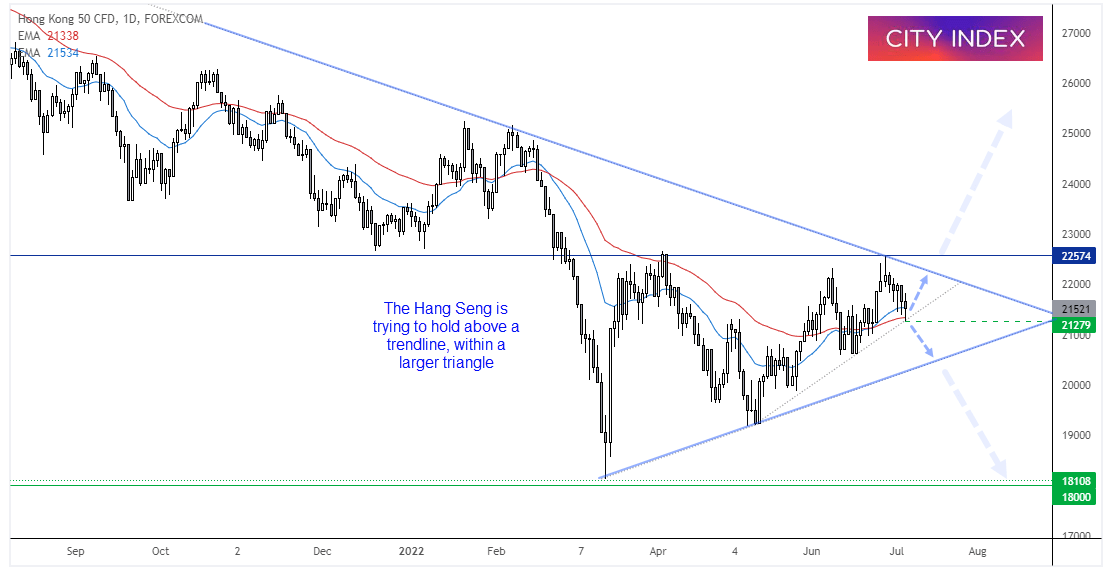
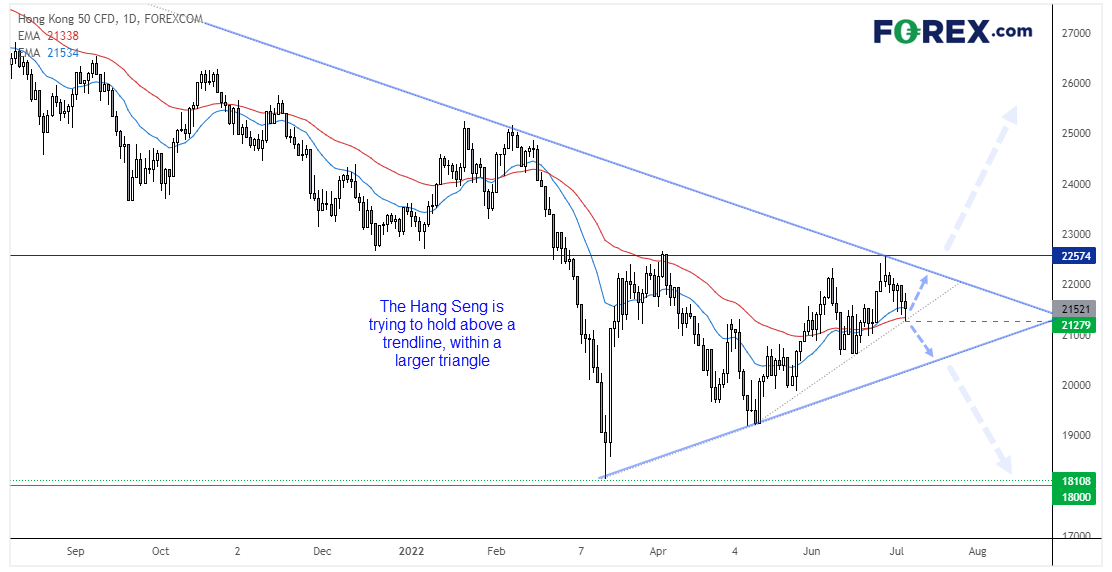
The daily chart is currently holding above trend support and the 20/50-day eMA within a larger triangle.
- Whilst prices hold above 21,280 then it may provide bullish setups on lower timeframes, over the near-term.
- A break of yesterday’s low invalidates the near-term bullish bias and brings the lower trendline into focus for bears.
- Due to the conflicting inflation across the three timeframes, traders may want to remain nimble and not seek large swings until we see a break above 22,600 or below the lower trendline.
How to trade with City Index
You can easily trade with City Index by using these four easy steps:
- Open an account, or log in if you’re already a customer
• Open an account in the UK
• Open an account in Australia
• Open an account in Singapore
- Search for the company you want to trade in our award-winning platform
- Choose your position and size, and your stop and limit levels
- Place the trade
How to trade with FOREX.com
Follow these easy steps to start trading with FOREX.com today:
- Open a Forex.com account, or log in if you’re already a customer.
- Search for the pair you want to trade in our award-winning platform.
- Choose your position and size, and your stop and limit levels.
- Place the trade.
Related tags:
Latest market news




The complete CFD trading experience
Award-winning platforms, competitive spreads, low commissions and dedicated support.
We live and breathe the markets and are dedicated to helping traders realise their ambitions as we continue to set the industry bar.
Economic calendar
Web Trader platform
Our sophisticated web-based platform is packed with features.
Related articles
USD/JPY Weekly Outlook: Volatility Has Left the Building
The yen has ignored broad dollar weakness, falling Treasury yields and renewed market turbulence. Yet its relationship with US interest rates remains intact. So why is USD/JPY going absolutely nowhere fast?
Swiss Franc Forecast: USD/CHF Seven-Week Rally Reverses From Yearly Highs 10 16 2026
A sharp rejection from fresh highs has shifted momentum in favor of USD/CHF bears, raising the stakes for a critical support test.

Magnificent Seven Earnings Preview: Is the AI Boom Facing Its Biggest Test Yet?
After a wobble in the broader AI trade, the Magnificent Seven" stocks are reporting earnings in the coming week - see the key themes and Nasdaq 100 levels to watch!

StoneX Europe Ltd may make third party material available on this website which may contain information included but not limited to the conditions of financial markets. The material is for information purposes only and does not contain, and should not be construed as containing, investment advice and/or investment recommendation and/or an investment research and/or an offer of or solicitation for any transactions in financial instruments; any decision to enter into a specific transaction shall be made by the client following an assessment by him/her of their situation.
StoneX Europe Ltd makes no representation or warranty and assumes no liability as to the accuracy or completeness of the information provided, nor any loss arising from any investment based on a recommendation, forecast or other information supplied. You should always seek independent advice as to your suitability to speculate in any related markets and your ability to assume the associated risks, if you are at all unsure. We are not under any obligation to update any such material. Any opinion made may be personal to the author and may not reflect the opinion of StoneX Europe Ltd.