




Japanese Yen into U.S. CPI: USD/JPY, EUR/JPY, GBP/JPY
U.S. CPI has had a large impact on USD/JPY over the past few years, and the pair pushing up to key resistance puts even more emphasis on tomorrow’s inflation print.
Share this:

Japanese Yen Talking Points:
- The deck is loaded for tomorrow’s U.S. CPI print as USD/JPY has showed multiple twists and turns around U.S. CPI releases over the past few years.
- There’s large macro implications as the carry trade drove global markets from 2021 and through 2022. More recently, Japanese yields have started to spike and threats of lower rates in the U.S. could give motive for carry trades to unwind. But – USD/JPY has been showing bullish price action since holding the 140.00 level in April, and the pair is cozying up to a massive spot of resistance around the 148.00 level.
- I’ll be looking at all three pairs after tomorrow’s CPI report in the weekly webinar. Click here to register.
USD/JPY has put in a strong rally since the Q3 open and price is nearing a massive spot of resistance right around the time that we get to a major data point for the pair.
The rate hike rally in the USD in 2021-2022 was especially notable against the Japanese Yen as the Bank of Japan kept rates pegged to the floor for most of the time. Hedge funds could borrow cheaply from Japanese banks and then invest that elsewhere as global rates were starting to lift, and that carry trade served as a form of global leverage. The only challenge with the trade was that with a Bank of Japan holding rates near zero, there was currency risk, so the logical next step was to hedge the trade by selling Yen and buying USD.
This also plays for retail traders in the form of swap or rollover, which will generally track the rate divergence between the economies represented in the pair. This incentived longs in USD/JPY as those buying the high-yielder and selling the low-yielder could earn rollover just for holding the position. And as others did the same, price could appreciate, allowing the trader that had previously bought to enjoy another form of benefit.
When the carry trade shows up it can be a beautiful backdrop for a trader or an investor – but like all things in life, there are ramifications. The trade can quickly become crowded and one-sided, which then makes the trend prone to pullbacks. This is what we saw in Q4 of 2022 and 2023, as a crowded trade unwound. The 2022 episode saw 50% of the 2021-2022 move erased in about three months, for more than 2,400 pips. While the 2023 episode saw more than 1,000 pips taken-out with a 23.6% retracement. And this is when fundamentals continued to favor the long side of USD/JPY.
That fundamental advantage is what helped USD/JPY to recover from each episode, and by the time April of last year rolled around, price was right back at the same 151.95 level that had held the highs for the two years prior.
This time, on the morning of April 10th, an above-expected CPI report brought question to whether the Fed would actually be able to cut rates in 2024. In fast fashion, a short squeeze developed – 151.95 was taken out, and USD/JPY jumped all the way up to the 160.00 handle.
What ultimately reversed the move was the CPI release in July; July 11th, to be exact, as that below-expected CPI finally gave hope to the fact that the Fed would be cutting. That led to a spiraling move in USD/JPY as the pair shed more than 2,000 pips over the next couple of months, until the pair finally found support at the 140 handle in September, just two days before the FOMC started cutting rates.
On the below chart, I’ve marked CPI releases for the past three years in USD/JPY, and you’ll notice that many turns take place around those data points. Certainly not every gyration can be explained by CPI, but ever since the carry trade took the pair to and above the 140.00 handle, quite a few of those trends can be defined by U.S. inflation releases.
USD/JPY Daily with U.S. CPI Releases Since July, 2022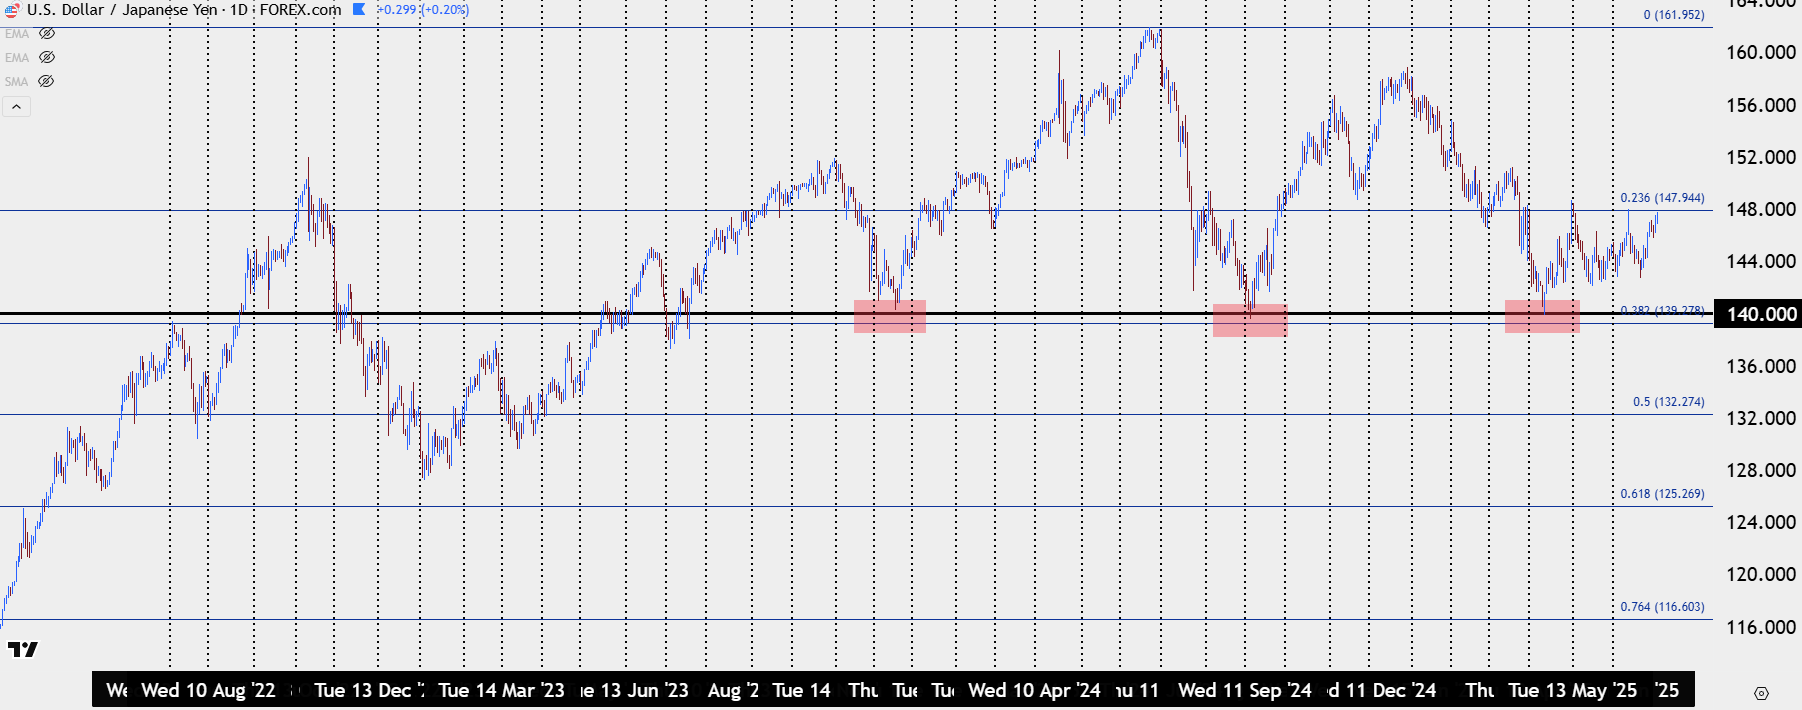
Chart prepared by James Stanley; data derived from Tradingview
Similar to last year, markets want rate cuts but the data hasn’t exactly cooperated. To be sure there have been more indications of economic weakness. But this time the Fed doesn’t seem to excited to give into market demands for lower rates as many Fed members have said that they fear of an inflationary impact from tariffs.
As markets were pricing in rate cuts for later in the year in Q1 of 2025, USD/JPY fell quickly, all the way until that familiar level of 140.00 came in to hold the lows in April. And since then – bears haven’t been able to crack support, with higher-lows developing at 142.50 and now that we’re in Q3, a bullish short-term trend has pushed price right up to resistance at the 148.00 handle.
This loads the deck for tomorrow’s U.S. CPI release, as there’s bullish potential via price action but buyers are probably going to need some motivation to finally be able to take out the 148.00 level, which is resistance at prior support after having held two inflections in Q2 trade.
USD/JPY Daily Chart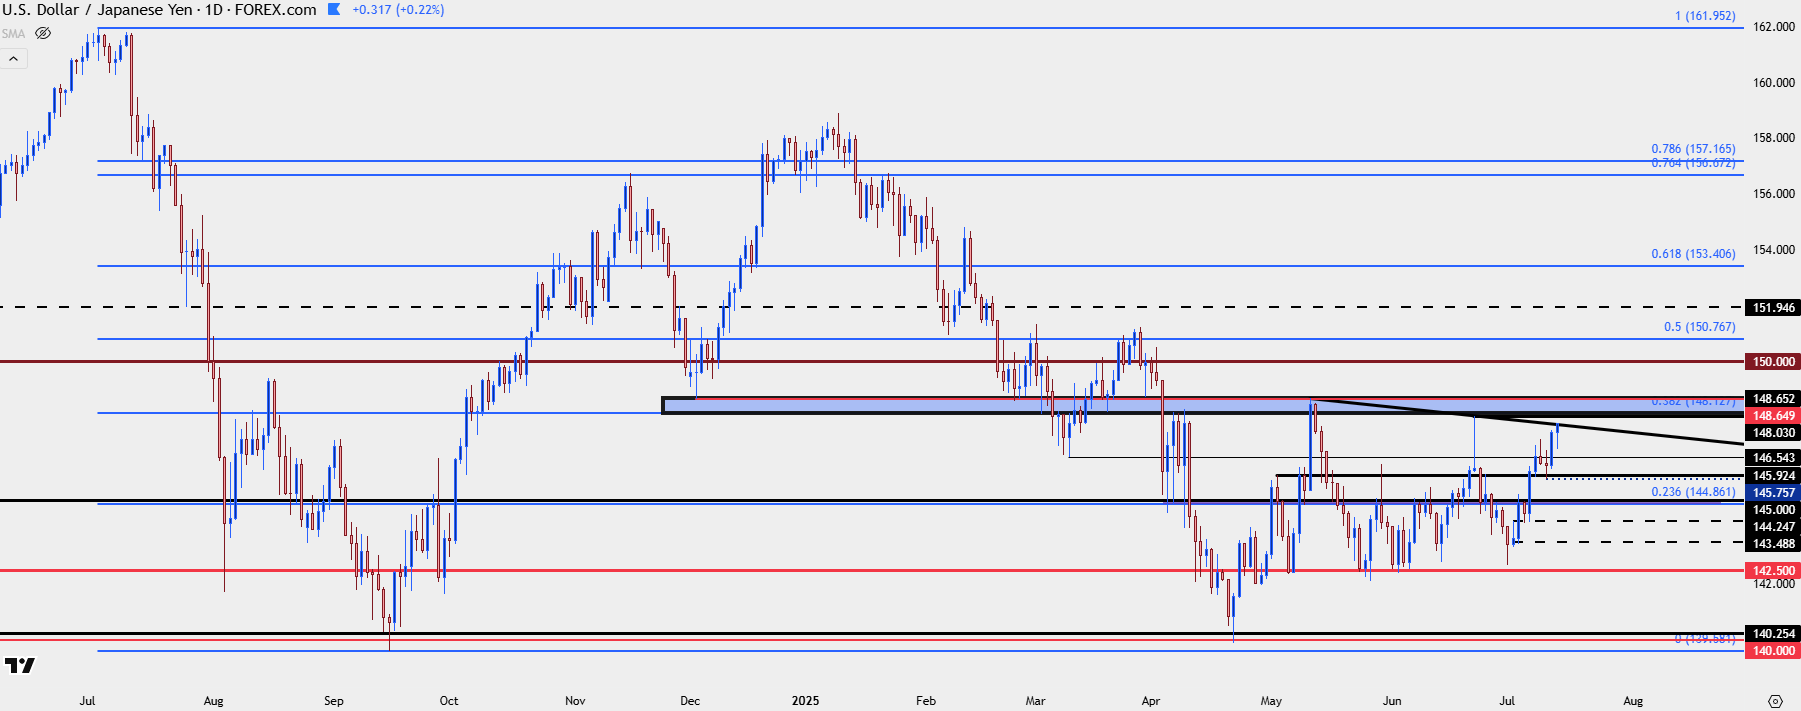
Chart prepared by James Stanley; data derived from Tradingview
Japanese Rates
Another item of note is on the Japanese side of the equation. There’s elections in Japan this week and that can certainly take a toll on macro trends, and Japanese long-term rates have been spiking of late. This puts another item of vulnerability around USD/JPY, as a below-expected CPI print tomorrow would not only break the trend of higher inflation readings, it would also probably increase the probability of the Fed cutting later this year, which could motivate carry trades to unwind.
If we see another episode of carry unwind taking over, that could cause another global de-leveraging event, such as we saw last summer. But, for now, higher-than-expected inflation could keep USD/JPY bears at bay which could actually be construed as a positive for risk assets.
JPY Weakness Elsewhere
JPY weakness has been a recent item of note on USD/JPY but given that the U.S. Dollar has been weak in it’s own right, the theme isn’t as noticeable as it’s been elsewhere. EUR/JPY, for instance, has pushed above the 170.00 level and that’s not a regular item, historically speaking.
The pair is overbought on both weekly and monthly charts which makes it difficult to chase-higher, but the support structure has been there, with last Monday showing support at the 170.00 level and then late-week support showing at the 78.6% retracement of last year’s sell-off.
Interestingly, a below-expected U.S. CPI print could be of interest for bulls here, as it could offer a pullback after which a support test could show up. I’d still be careful of chasing topside breakouts in the pair but pullbacks to support, particularly if at prior resistance, could at least offer some lines in the sand for risk analysis.
EUR/JPY Four-Hour Price Chart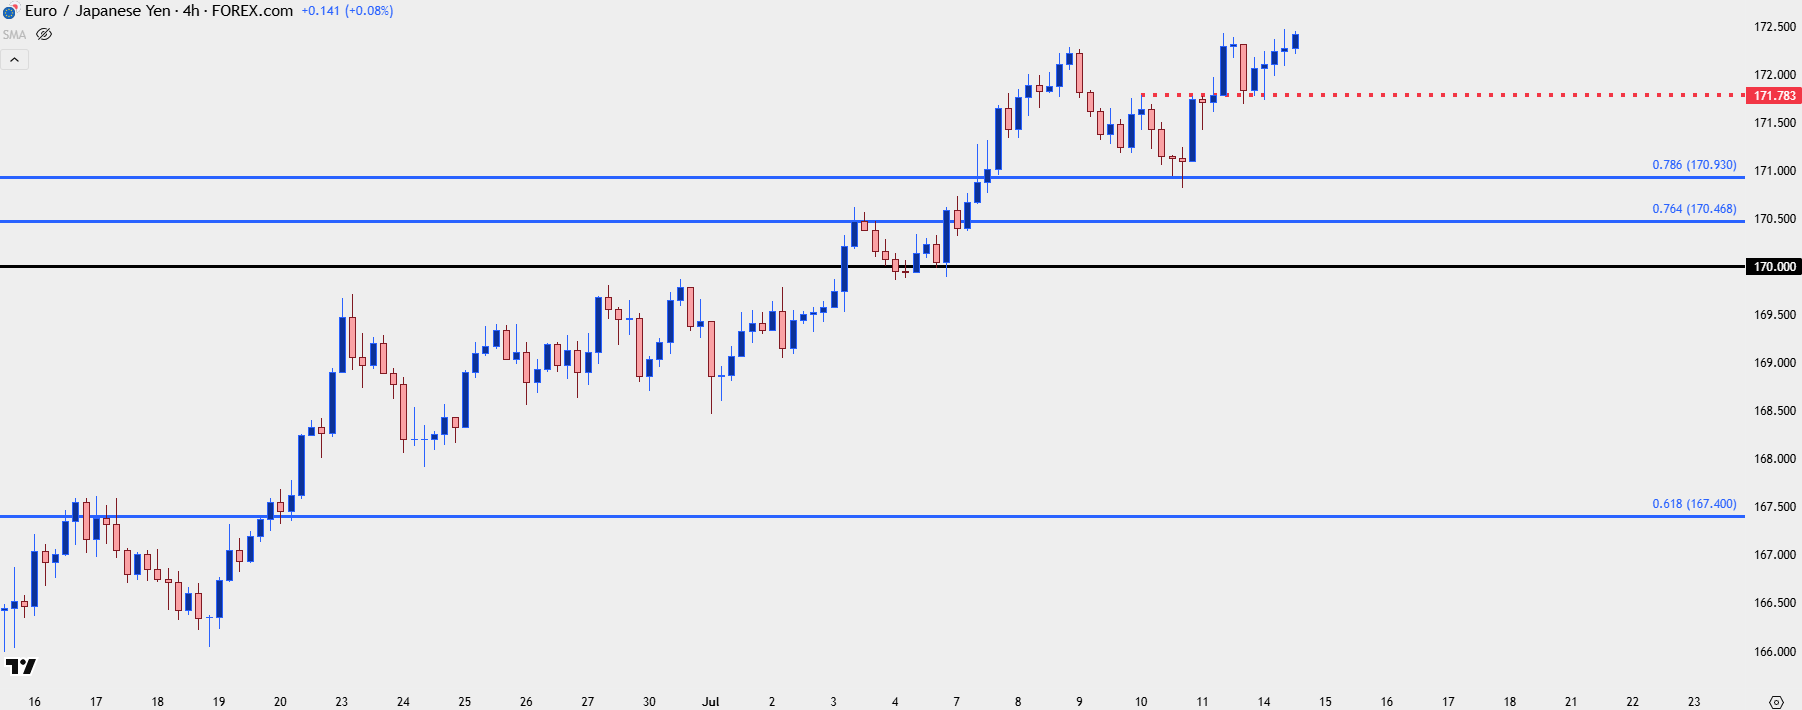
Chart prepared by James Stanley; data derived from Tradingview
GBP/JPY
GBP/JPY is currently testing support around the 198.50 level that was prior resistance in late-July. There’s so far been a hold above the 198.08 level that’s the top of the gap from back in 2008. Shorter-term, there’s lower-highs to go along with horizontal support so this could be opening the door for a larger pullback, with deeper support potential around 197.71-197.82 and then 197.06-197.22.
But notably, if we do see a continued hold of 198.40-198.50, that would be an illustration of bullish anticipation that could be construed for bullish continuation scenarios.
GBP/JPY Four-Hour Chart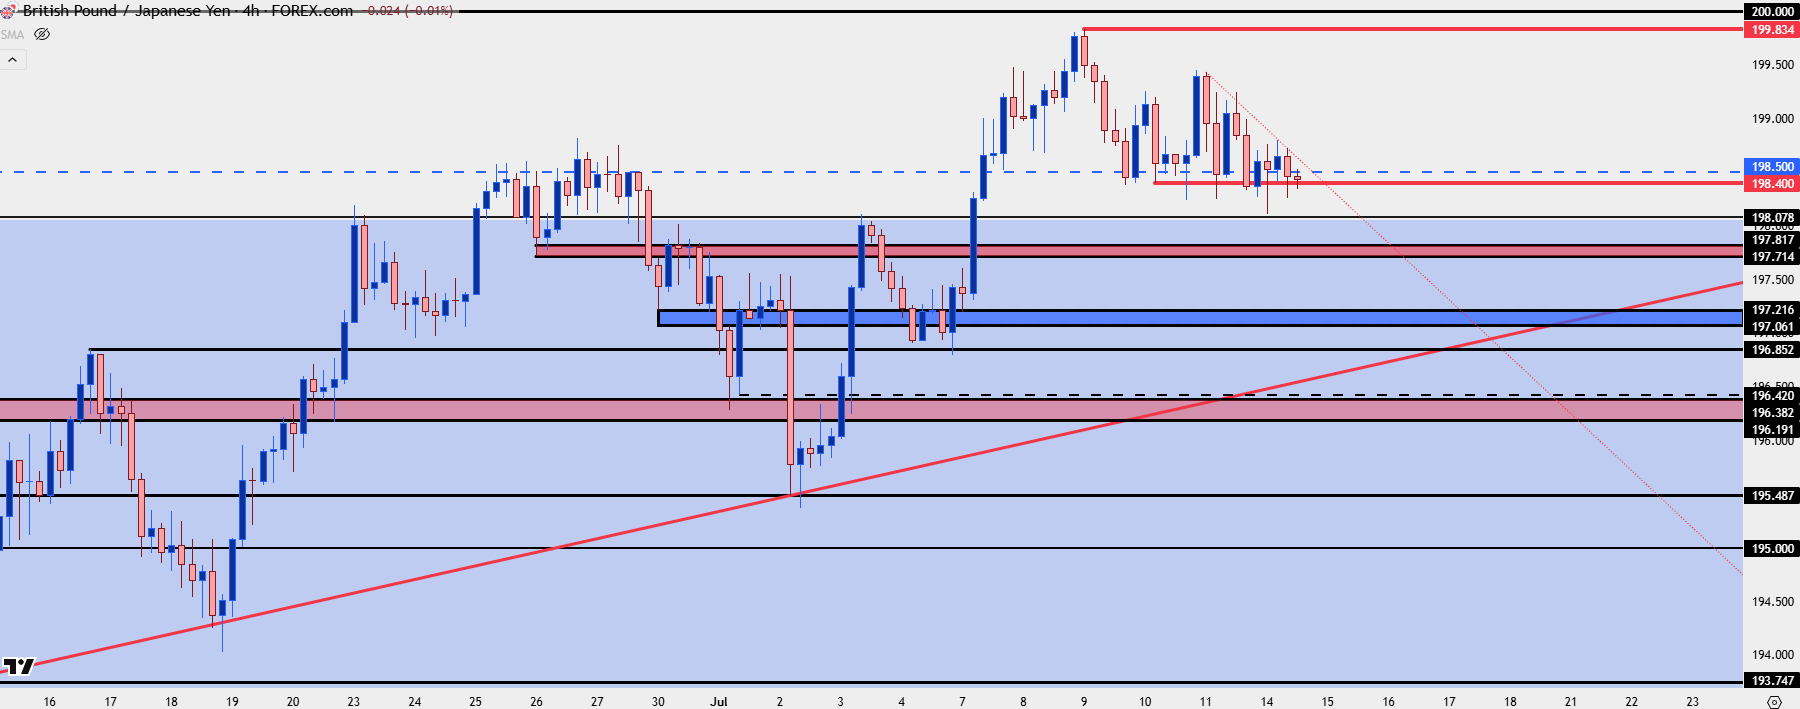
Chart prepared by James Stanley; data derived from Tradingview
--- written by James Stanley, Senior Strategist
Related tags:




The complete CFD trading experience
Award-winning platforms, competitive spreads, low commissions and dedicated support.
We live and breathe the markets and are dedicated to helping traders realise their ambitions as we continue to set the industry bar.
Economic calendar
Web Trader platform
Our sophisticated web-based platform is packed with features.
Related articles
StoneX Europe Ltd may make third party material available on this website which may contain information included but not limited to the conditions of financial markets. The material is for information purposes only and does not contain, and should not be construed as containing, investment advice and/or investment recommendation and/or an investment research and/or an offer of or solicitation for any transactions in financial instruments; any decision to enter into a specific transaction shall be made by the client following an assessment by him/her of their situation.
StoneX Europe Ltd makes no representation or warranty and assumes no liability as to the accuracy or completeness of the information provided, nor any loss arising from any investment based on a recommendation, forecast or other information supplied. You should always seek independent advice as to your suitability to speculate in any related markets and your ability to assume the associated risks, if you are at all unsure. We are not under any obligation to update any such material. Any opinion made may be personal to the author and may not reflect the opinion of StoneX Europe Ltd.