



Meta (META) Q4 Earnings Preview: Facebook and Instagram Ads in Focus
Meta’s Q4 earnings will hinge on Facebook and Instagram ad performance, with high expectations leaving little room for error despite strong recent gains.
Share this:

Meta Platforms (META) is set to report quarterly earnings after the US market close, with traders watching closely to see whether strong advertising momentum can offset ongoing heavy investment in AI and infrastructure.
META shares have been one of the standout performers among US tech stocks over the past year, supported by a rebound in digital advertising, aggressive cost controls, and optimism around artificial intelligence. With expectations already high and valuations stretched relative to historical averages, Meta may need to deliver more than solid results to justify further upside, while broader macro uncertainty and fragile risk sentiment could continue to influence price action into earnings.
View related analysis:
View related analysis:
What to Watch in Meta’s Earnings Report
Advertising Revenue – The Core Earnings Driver
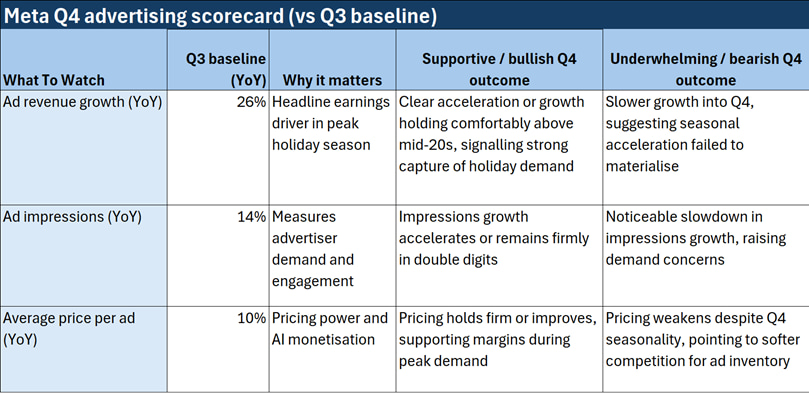
Advertising accounts for the vast majority of Meta’s revenue, making ad pricing and volumes the most important metrics for traders. With Q4 typically Meta’s strongest quarter due to peak holiday demand, markets will be watching closely to see whether advertising growth across Facebook and Instagram lived up to expectations. Given the stock’s strong run into earnings, any signs of softer-than-expected Q4 ad demand could weigh on META shares.
Key numbers to watch include advertising revenue growth, ad impressions, and average price per ad, which together signal advertiser demand and pricing power. Rising impressions alongside stable or improving pricing would point to healthy Q4 conditions, while falling impressions or weaker pricing during peak season would be harder for markets to overlook. As a result, the earnings reaction is likely to hinge more on Q4 ad performance than headline EPS, with guidance providing secondary confirmation rather than the main driver.
Source: NASDAQ, TradingView
AI Investment – Growth Engine or Margin Headwind?
Meta’s push into artificial intelligence remains a double-edged sword for investors. While AI-driven ad targeting and engagement tools are viewed as long-term positives, near-term costs remain significant.
Management commentary around capital expenditure, operating margins, and the timeline for AI monetisation will be closely scrutinised. Traders will be looking for reassurance that margin expansion can continue alongside elevated AI investment.
While AI remains central to Meta’s long-term strategy, its near-term impact is more likely to be felt through costs and margins rather than revenue growth, keeping advertising performance as the primary earnings driver this quarter.
Reality Labs – A Known Drag, Not the Swing Factor
Losses in Meta’s Reality Labs division remain a known drag rather than a key earnings catalyst, with markets already factoring in ongoing losses and recent plans to cut around 10,000 roles as part of broader efficiency measures. While Meta continues to invest in long-term metaverse and wearable ambitions, expectations for near-term financial impact remain low, leaving limited scope for Reality Labs to drive an earnings surprise unless losses narrow materially faster than forecast.
Guidance Risk – Where Earnings Volatility Lives
As with other mega-cap tech stocks, META’s earnings reaction may depend less on backward-looking results and more on forward guidance. Outlook for ad growth, expenses, and capital expenditure will be key inputs for short-term price action.
Options markets are currently pricing in a sizeable post-earnings move, highlighting the potential for increased volatility in META shares following the release.


META Share Price – Technical Levels to Watch
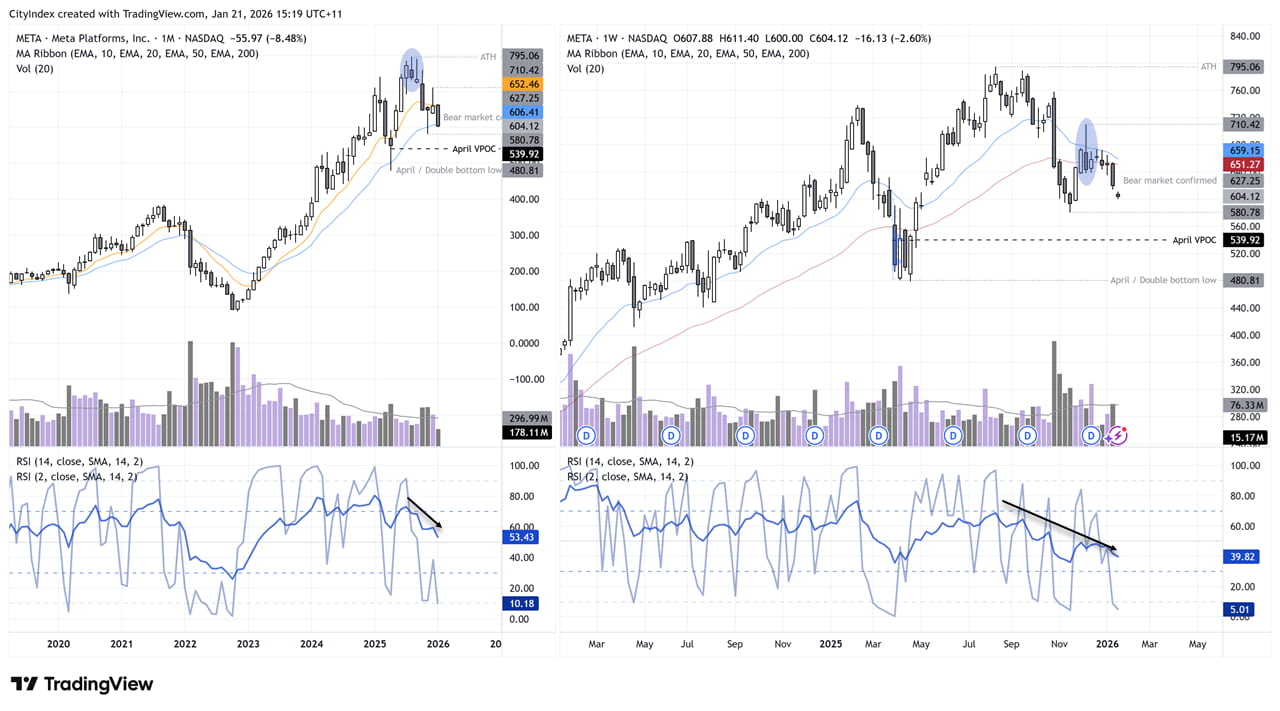
The monthly chart shows META enjoyed a strong rally from the November 2022 low to its 2025 high, although declining volumes suggested the bull trend was beginning to mature. Bearish hammer formations near record highs warned of a potential reversal, which were then confirmed by subsequent bearish candles accompanied by rising volume.
This shift points to a change in underlying momentum, leaving META more vulnerable to further downside should earnings or guidance disappoint. The monthly RSI (14) is also trending lower alongside prices, reinforcing the loss of upside momentum.
On the weekly chart, a prominent swing high in the form of a shooting star emerged at 710.42, with momentum having since rolled over. META also entered a technical bear market at last week’s close, having fallen more than 20% from its weekly closing high.
Against a backdrop of broader geopolitical uncertainty and fragile risk sentiment, the stock may remain one that traders look to fade on rallies rather than chase higher. A sustained break below 580 could open the door to a move towards the April VPOC near 540, with the 500 handle or even the 480 low coming into focus if risk appetite deteriorates further.
 Source: NASDAQ, TradingView
Bottom Line for Meta Q4 Earnings
- Meta’s earnings report comes with high expectations already priced in, leaving limited room for error.
- Reality Labs layoffs are largely old news, while wearables offer long-term optionality rather than near-term earnings impact.
- Any positive reaction is more likely to be driven by advertising performance and margins, with wearables acting as a supportive narrative.
- Strong ad growth and confident guidance could extend the rally, but any disappointment on growth or costs risks a sharper pullback.
View the full economic calendar
View the full economic calendar
-- Written by Matt Simpson
Follow Matt on Twitter @cLeverEdge
How to trade with City Index
You can trade with City Index by following these four easy steps:
- Open an account, or log in if you’re already a customer
• Open an account in the UK
• Open an account in Australia
• Open an account in Singapore
- Search for the market you want to trade in our award-winning platform
- Choose your position and size, and your stop and limit levels
- Place the trade



The complete CFD trading experience
Award-winning platforms, competitive spreads, low commissions and dedicated support.
We live and breathe the markets and are dedicated to helping traders realise their ambitions as we continue to set the industry bar.
Economic calendar
Web Trader platform
Our sophisticated web-based platform is packed with features.
Related articles

Magnificent Seven Earnings Preview: Is the AI Boom Facing Its Biggest Test Yet?
After a wobble in the broader AI trade, the Magnificent Seven" stocks are reporting earnings in the coming week - see the key themes and Nasdaq 100 levels to watch!


Dow Jones Analysis: Is the DJIA Making a Comeback?
Recent trading sessions have become increasingly relevant for the Dow Jones, as the index has started to regain bullish momentum heading into the end of the week. Over the last three sessions, the DJIA has advanced by more than 0.6%, allowing buying pressure to regain prominence and raising the possibility of a more consistent short-term recovery.


Stocks on Watch After CPI-Fueled Breakdown: SPX, Nasdaq, NVDA
Coming into the week there was an early case of divergence as AI and tech had started to show lag behind the S&P. That shift is growing more noticeable following a higher-than-expected CPI print.

StoneX Europe Ltd may make third party material available on this website which may contain information included but not limited to the conditions of financial markets. The material is for information purposes only and does not contain, and should not be construed as containing, investment advice and/or investment recommendation and/or an investment research and/or an offer of or solicitation for any transactions in financial instruments; any decision to enter into a specific transaction shall be made by the client following an assessment by him/her of their situation.
StoneX Europe Ltd makes no representation or warranty and assumes no liability as to the accuracy or completeness of the information provided, nor any loss arising from any investment based on a recommendation, forecast or other information supplied. You should always seek independent advice as to your suitability to speculate in any related markets and your ability to assume the associated risks, if you are at all unsure. We are not under any obligation to update any such material. Any opinion made may be personal to the author and may not reflect the opinion of StoneX Europe Ltd.