



Nasdaq 100 Outlook: The Index Starts the Year with Confidence and Approaches All-Time Highs
At the start of the year, the Nasdaq index has managed to post a three-session winning streak, recording gains of more than 2% in the short term. Current buying pressure has allowed the index to move back toward its all-time highs, driven mainly by a sustained recovery in market confidence over recent sessions and by the reduced appeal of substitute assets relative to equities in the short term.
Share this:

At the start of the year, the Nasdaq index has managed to post a three-session winning streak, recording gains of more than 2% in the short term. Current buying pressure has allowed the index to move back toward its all-time highs, driven mainly by a sustained recovery in market confidence over recent sessions and by the reduced appeal of substitute assets relative to equities in the short term. This environment has supported a solid recovery in the index, which could extend into the coming trading sessions.


Factors Driving Bullish Pressure
The beginning of 2026 has been accompanied by a renewed sense of confidence in equity markets. Part of this optimism can be explained by the recent behavior of U.S. 10-year Treasury yields, which have once again declined from recent highs near 4.2% and are now moving back toward the 4.0% area, showing a negative slope. Lower bond yields reduce the relative attractiveness of fixed-income investments, opening the door for capital flows to shift toward higher-risk assets, such as the Nasdaq.
It is important to note that this move in yields is partly driven by uncertainty surrounding whether the Federal Reserve will implement additional rate cuts in the coming months. Greater clarity on this front may begin to emerge with the release of the Non-Farm Payrolls (NFP) employment data scheduled for Friday, a key event for guiding monetary policy expectations.
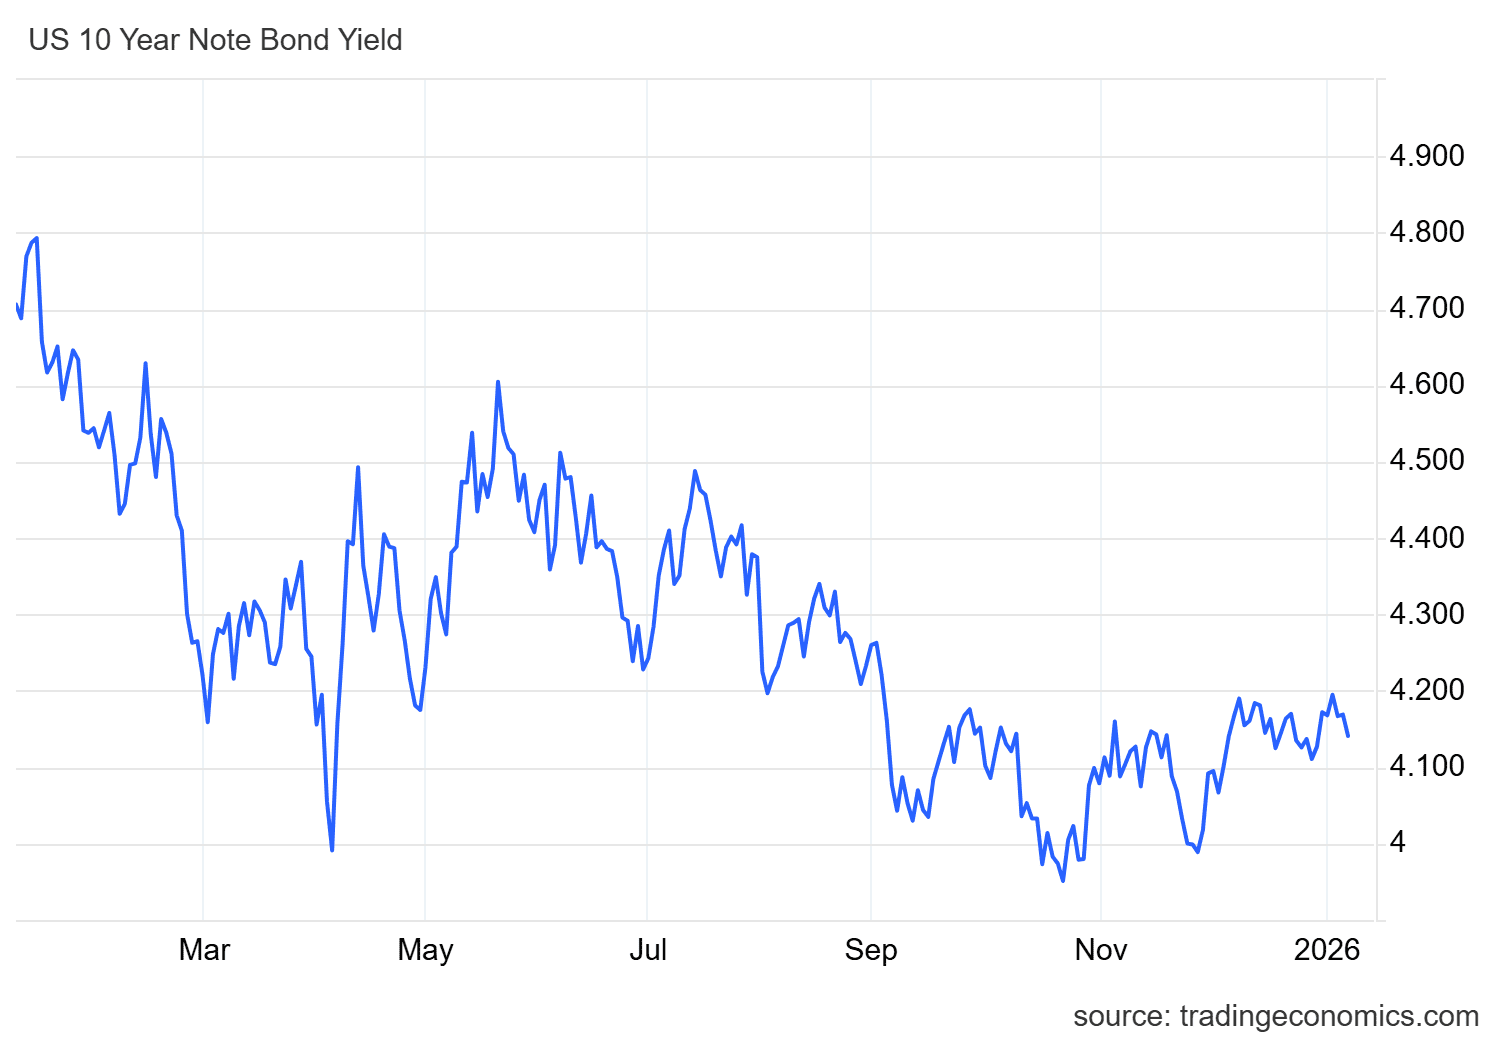
Source: TradingEconomics
Additionally, the start-of-year effect may also be supporting stronger demand for Nasdaq components. Following the close of 2025, many institutional portfolios have begun to rebuild exposure for 2026, favoring capital inflows into equities. This phenomenon, commonly referred to as the “January effect,” is typically associated with portfolio rebalancing processes that drive renewed flows into stocks, contributing to the buying pressure seen in the short term.
Finally, and no less importantly, the Fear & Greed Index has shown a recovery during the first trading sessions of January, moving back above the 50-point level and into neutral territory, distancing itself from the “fear” zone. This improvement in confidence levels reinforces the view that demand for risk assets, such as the Nasdaq, has begun to gain relevance in the short term.
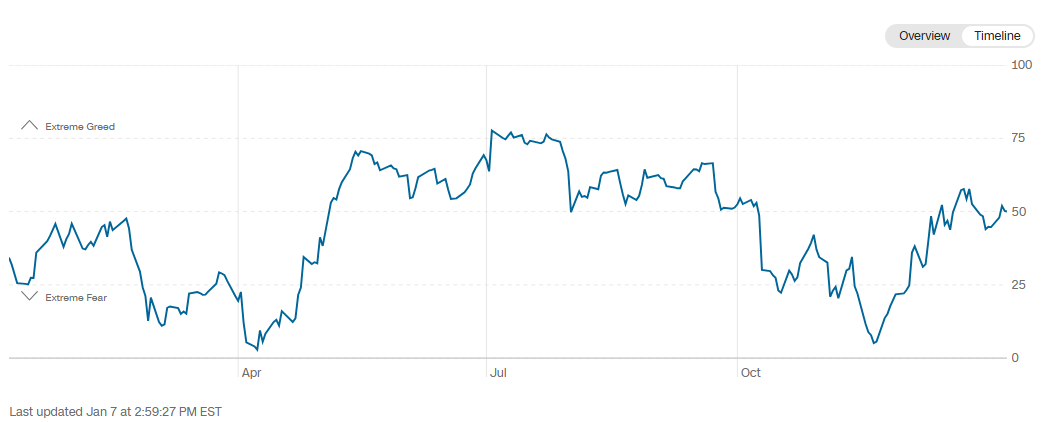
Source: CNN
Taken together, the rebound in confidence, the declining appeal of substitute assets, and the seasonal start-of-year effect appear to be acting as key catalysts supporting sustained demand for the Nasdaq during the early sessions of 2026. As long as these factors remain in place, buying pressure is likely to continue dominating short-term index movements.
Nasdaq Technical Outlook
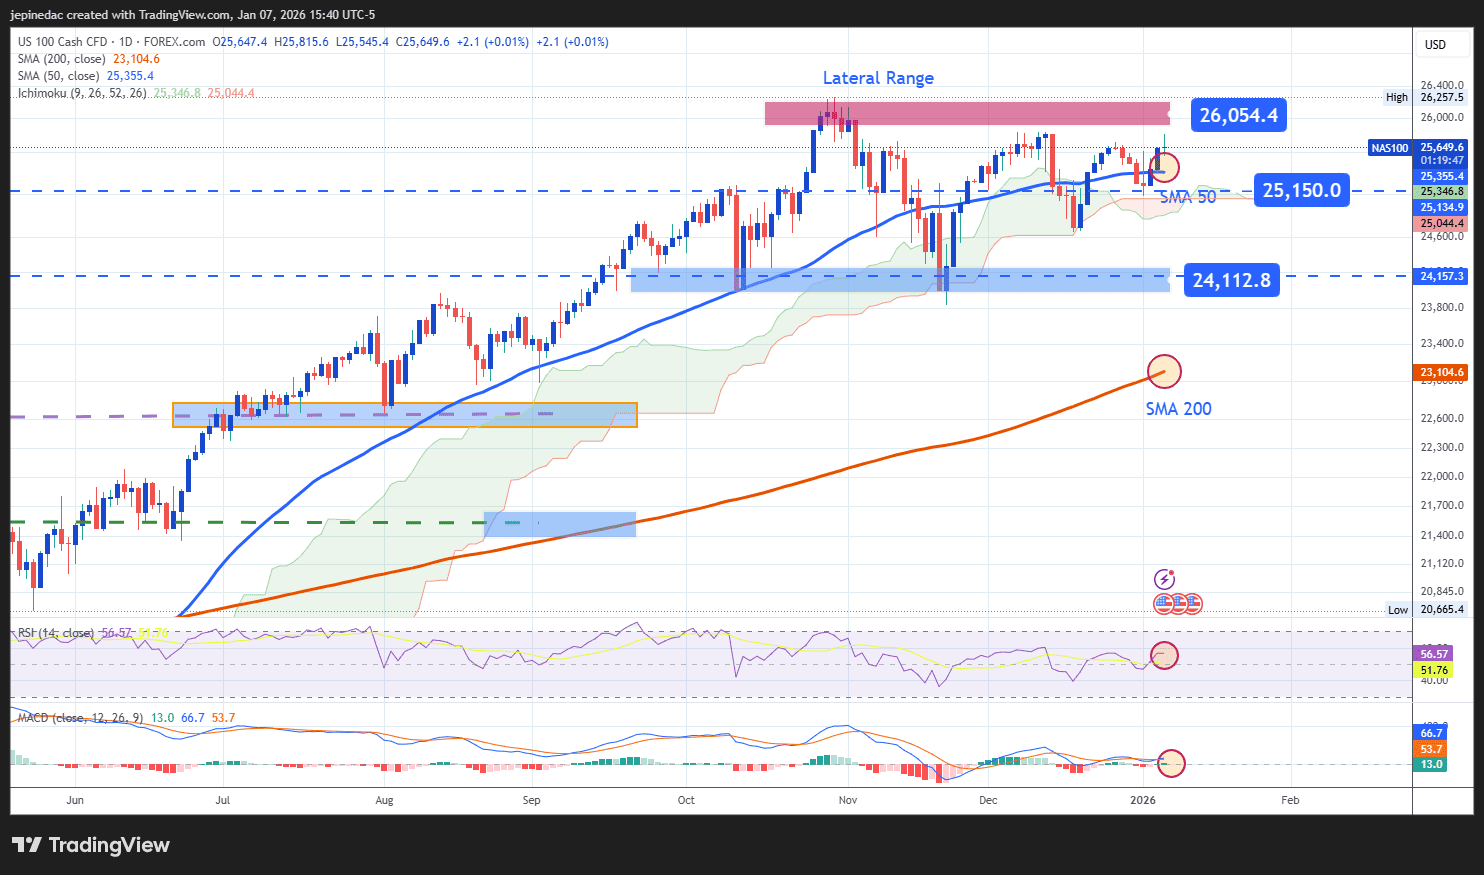
Source: StoneX, Tradingview
- A dominant sideways range remains in place: Over recent months, the Nasdaq has traded within a well-defined sideways range, capped near 26,054 points and supported around 24,112 points. So far, the recovery in price has not been strong enough to break this structure, leaving the range as the most relevant technical formation in the short term. Until a clear breakout occurs, confirming a sustained bullish trend may remain challenging.
- RSI: The RSI has remained consistently above the neutral 50 level, indicating that buying momentum has started to gain relevance. If the indicator continues to advance, it could further reinforce bullish pressure in Nasdaq price action over the short term.
- MACD: By contrast, the MACD continues to show a histogram oscillating around the neutral zero line, suggesting that neutrality remains dominant in short-term moving average momentum. Unless the histogram begins to expand decisively, this behavior may signal a phase of price indecision in the near term.
Key Levels:
- 26,054 points – Key resistance: A level that aligns with the Nasdaq’s all-time highs and represents the most important upside barrier to monitor. A sustained move above this zone could activate a more consistent bullish bias and pave the way for a short-term uptrend.
- 25,150 points – Nearby barrier: A neutrality level corresponding to the midpoint of the current sideways range. Price action around this area could reinforce indecision and extend the life of the consolidation range.
- 24,112 points – Key support: A level corresponding to lows not seen since November 2025. Selling pressure toward this area could activate a dominant bearish bias over the coming weeks.
Written by Julian Pineda, CFA, CMT – Market Analyst
Follow him on: @julianpineda25
Related tags:




The complete CFD trading experience
Award-winning platforms, competitive spreads, low commissions and dedicated support.
We live and breathe the markets and are dedicated to helping traders realise their ambitions as we continue to set the industry bar.
Economic calendar
Web Trader platform
Our sophisticated web-based platform is packed with features.
Related articles

Nasdaq 100 Forecast: NDX slips as Treasury yields keep rising
U.S. stocks are falling at the start of Q4, as gains in software stocks offset concerns over soaring Treasury yields. U.S. Treasury yields continue to rise, with the 10-year yield up 2 basis points at 5.31% and the 30-year at 5.66%, multi-decade highs.


Dow Jones forecast: Stock markets under pressure from multiple sources
When looking at the major tech-heavy US indices like the S&P 500 or the Nasdaq 100, you wouldn’t think that the stock market is particularly weak. Yet, beneath the surface, the market is far from healthy right now. Investors are evidently just piling into the big tech and AI names, and as a result, market breadth is deteriorating. Other indices like the small cap Russell 2000 and the Dow Jones are starting to reflect that weakness.


Nikkei breakout accelerates as yen weakness returns
Nikkei has started October with a powerful breakout, helped by renewed yen weakness and strong upside momentum
StoneX Europe Ltd may make third party material available on this website which may contain information included but not limited to the conditions of financial markets. The material is for information purposes only and does not contain, and should not be construed as containing, investment advice and/or investment recommendation and/or an investment research and/or an offer of or solicitation for any transactions in financial instruments; any decision to enter into a specific transaction shall be made by the client following an assessment by him/her of their situation.
StoneX Europe Ltd makes no representation or warranty and assumes no liability as to the accuracy or completeness of the information provided, nor any loss arising from any investment based on a recommendation, forecast or other information supplied. You should always seek independent advice as to your suitability to speculate in any related markets and your ability to assume the associated risks, if you are at all unsure. We are not under any obligation to update any such material. Any opinion made may be personal to the author and may not reflect the opinion of StoneX Europe Ltd.