



Natural Gas Futures Solid Long Term Rebound
China's industrial production rose 6.9% in September, the fastest growth since December last year and better than 5.8% expected, which should be positive to Natural Gas prices...
Share this:

Data released on Monday showed that China's 3Q GDP grew 4.9% on year, below estimate of 5.5%. However, industrial production rose 6.9% in September, the fastest growth since December last year and better than 5.8% expected, suggesting that Chinese economic activity is still on a strong footing. As industrial demand appears to be recovering from the coronavirus pandemic, outlook for natural gas remains positive.
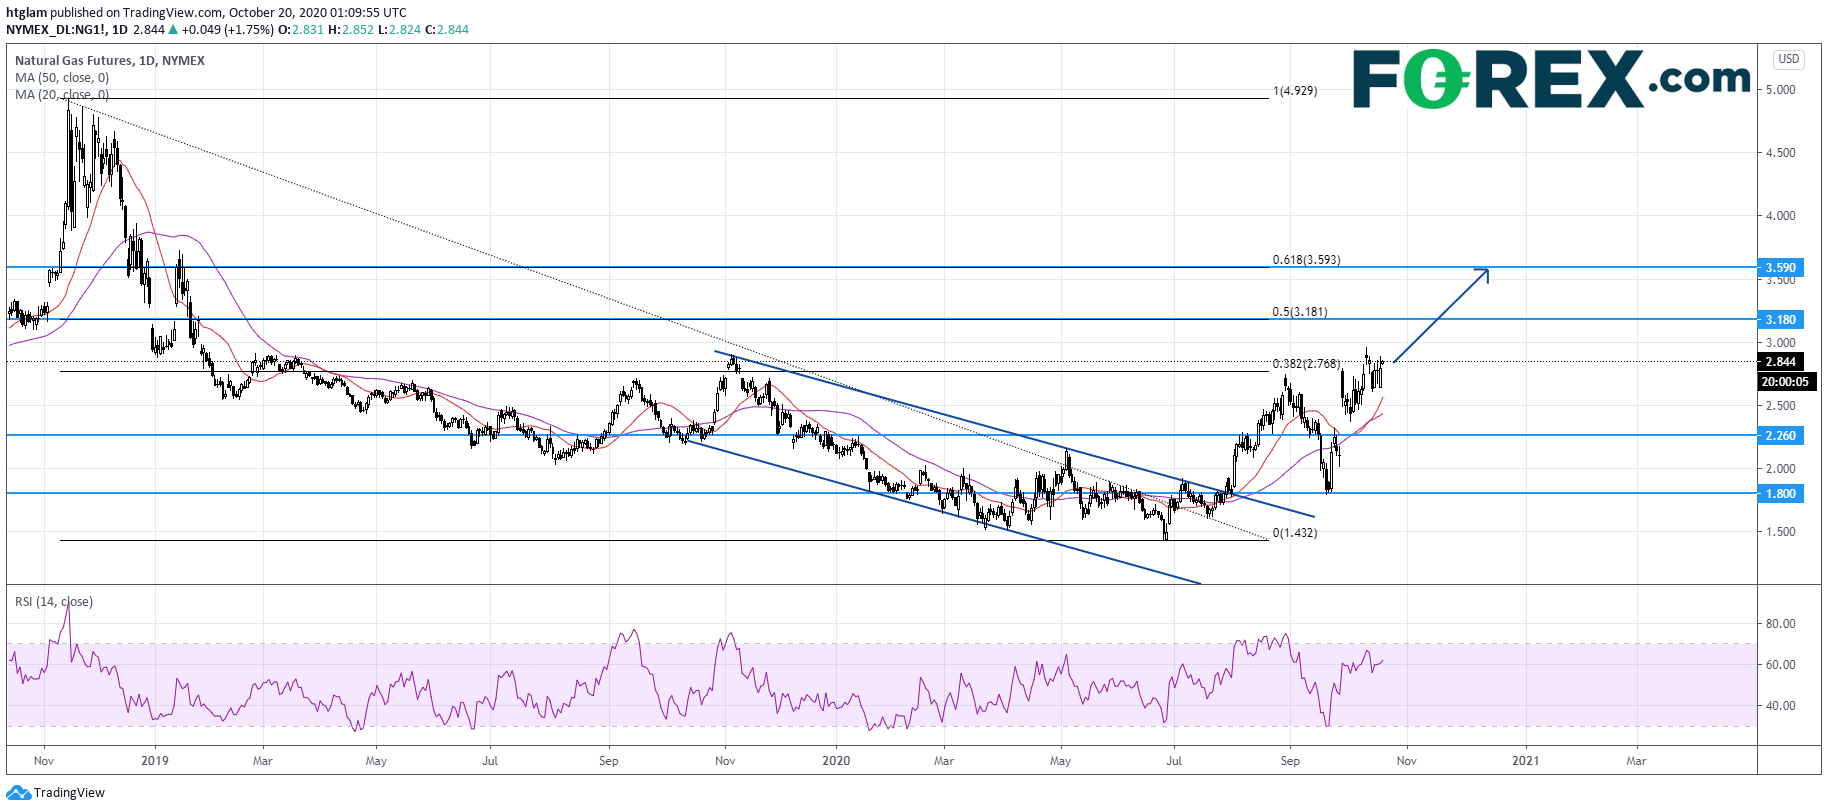
From a technical point of view, NYMEX Natural Gas Futures are extending the rebound as shown on a daily chart. It has now surpassed the 38.2% Fibonacci retracement resistance of the decline started in late 2018, opening a path to the 50.0% and 61.8% retracement levels. The level at $2.26 might be considered as the nearest support, while the 1st and 2nd resistance are expected to be located at $3.18 and $3.59 respectively.
Source: Gain Capital, TradingView
Data released on Monday showed that China's 3Q GDP grew 4.9% on year, below estimate of 5.5%. However, industrial production rose 6.9% in September, the fastest growth since December last year and better than 5.8% expected, suggesting that Chinese economic activity is still on a strong footing. As industrial demand appears to be recovering from the coronavirus pandemic, outlook for natural gas remains positive.
From a technical point of view, NYMEX Natural Gas Futures are extending the rebound as shown on a daily chart. It has now surpassed the 38.2% Fibonacci retracement resistance of the decline started in late 2018, opening a path to the 50.0% and 61.8% retracement levels. The level at $2.26 might be considered as the nearest support, while the 1st and 2nd resistance are expected to be located at $3.18 and $3.59 respectively.
Source: Gain Capital, TradingView
Related tags:
Latest market news



The complete CFD trading experience
Award-winning platforms, competitive spreads, low commissions and dedicated support.
We live and breathe the markets and are dedicated to helping traders realise their ambitions as we continue to set the industry bar.
Economic calendar
Web Trader platform
Our sophisticated web-based platform is packed with features.
Related articles

Gold Price Forecast: XAU/USD Plunges 12.4% Toward Critical Support 10 1 2026
Softer inflation has revived expectations for a Fed pause, but Friday’s payrolls could put gold’s recovery prospects to the test.


Treasury Yields Lose Momentum as Energy ETF Retreats
The 10-year Treasury yield is testing a resistance zone respected since the 1920s, as bearish RSI divergence signals fading upside momentum.


Gold, silver shrug off a brutal macro stress test
A hawkish Fed, surging short-dated Treasury yields and a firmer dollar failed to deliver the kind of damage usually seen in precious metals.

StoneX Europe Ltd may make third party material available on this website which may contain information included but not limited to the conditions of financial markets. The material is for information purposes only and does not contain, and should not be construed as containing, investment advice and/or investment recommendation and/or an investment research and/or an offer of or solicitation for any transactions in financial instruments; any decision to enter into a specific transaction shall be made by the client following an assessment by him/her of their situation.
StoneX Europe Ltd makes no representation or warranty and assumes no liability as to the accuracy or completeness of the information provided, nor any loss arising from any investment based on a recommendation, forecast or other information supplied. You should always seek independent advice as to your suitability to speculate in any related markets and your ability to assume the associated risks, if you are at all unsure. We are not under any obligation to update any such material. Any opinion made may be personal to the author and may not reflect the opinion of StoneX Europe Ltd.