



Nikkei 225: Breakdown Risk Rising Fast
The Nikkei’s largest drop since October has brought a critical support cluster into play. With momentum rolling over and macro risks mounting, the balance of risk is starting to tilt lower.
Share this:

- Largest drop since October tests major support cluster
- Momentum rolling over as macro risks intensify
- Break below 53,600 could accelerate downside
The once invincible Nikkei 225 is looking vulnerable, battling a combination of stretched positioning and a fundamental backdrop that looks perilous for the energy-intensive yet import-reliant Japanese economy.
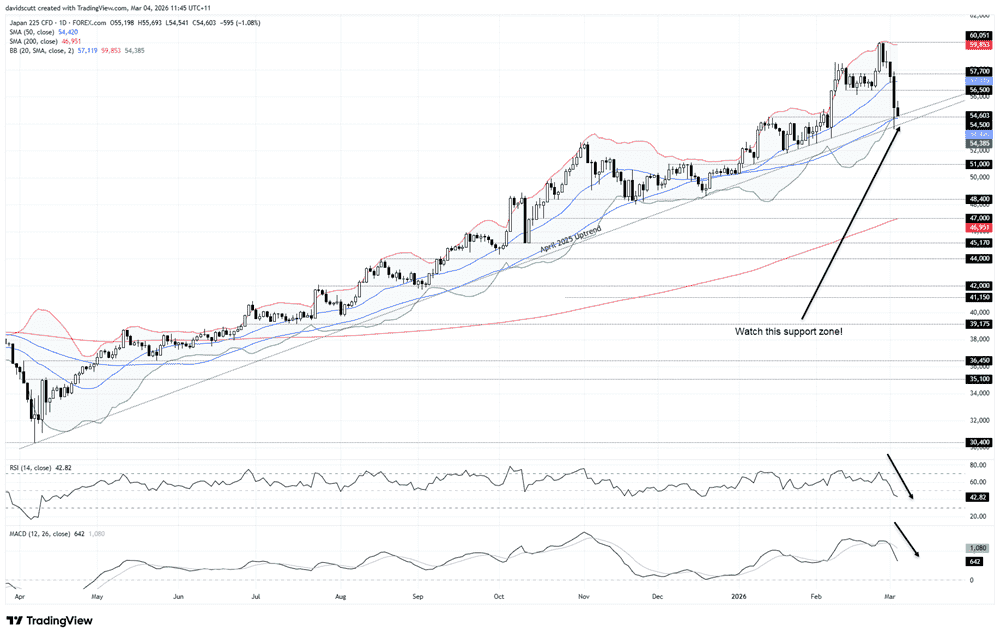
The index suffered its largest decline since October on Tuesday, taking out several minor levels before the move eventually stalled at the confluence of key technical levels, including the April 2025 uptrend, the 50-day moving average, horizontal support at 54,500 and uptrend support dating back to the start of the year.
This zone now looms as key. Break beneath it and directional risks skew lower for the index. Hold above and bulls can start thinking about an eventual retest of the record highs set only last week.
Source: TradingView
Given the price action, the message from the oscillators and the bearish fundamental backdrop, unless bulls are prepared to battle the prevailing macro tide, the risk of the index breaking lower is undoubtedly growing.
54,500 down to 53,600, Tuesday’s low, are the near-term levels to watch. If we see a break beneath the latter, it may prompt a combination of profit-taking and an influx of fresh short positions, given it would deliver a trend break.
If the next downside attempt has more staying power, shorts could be set with a stop above any of the former support levels for protection, targeting either 53,000, 52,000 or 51,000 depending on desired risk-reward.
While technicals sometimes lose relevance during periods of extreme volatility or outright market dislocation, unless we see a definitive break or close beneath the level, there’s little reason to pre-empt the move given the confluence of support beneath where price currently trades. With the index also nearing the lower Bollinger band, it underlines the pace of the unwind already seen.
Mirroring the price action, momentum also looks to be turning. RSI (14) has moved from overbought to beneath the neutral 50 level in the space of a week, indicating downside pressure is starting to build. MACD has yet to confirm, although it has already crossed below the signal line and is trending lower. Given the trajectory, it could soon confirm the broader bearish signal, favouring selling rallies rather than buying dips.
Of course, poor price action and heavy oscillators don’t automatically mean we’ll see a downside break. If the support zone continues to hold, longs could be set above it with a stop beneath Tuesday’s low, targeting a return to former support at 56,500 initially. Of the two setups, this screens as the less preferred given the current climate.
Related tags:
Latest market news




The complete CFD trading experience
Award-winning platforms, competitive spreads, low commissions and dedicated support.
We live and breathe the markets and are dedicated to helping traders realise their ambitions as we continue to set the industry bar.
Economic calendar
Web Trader platform
Our sophisticated web-based platform is packed with features.
Related articles
Swiss Franc Short-term Outlook: USD/CHF Selloff Nears Critical Support Ahead of NFP 11 4 2026
USD/CHF bears are closing in on critical trend support, with the next reaction likely to determine whether the October decline has further to run.

US Midterm Fallout: What Does the “Blue Tsunami” Mean for the S&P 500?
Democrats made sweeping gains in the US midterm elections, winning control of both the House and Senate - what does it mean for the S&P 500 and the AI trade?

Euro Technical Outlook: EUR/USD Support Reversal Sets Up Breakout Test Ahead of NFP 11 4 2026
Euro bulls are attempting to build on the rebound from recent lows, but pivotal resistance still stands in the way of a larger EUR/USD recovery.
StoneX Europe Ltd may make third party material available on this website which may contain information included but not limited to the conditions of financial markets. The material is for information purposes only and does not contain, and should not be construed as containing, investment advice and/or investment recommendation and/or an investment research and/or an offer of or solicitation for any transactions in financial instruments; any decision to enter into a specific transaction shall be made by the client following an assessment by him/her of their situation.
StoneX Europe Ltd makes no representation or warranty and assumes no liability as to the accuracy or completeness of the information provided, nor any loss arising from any investment based on a recommendation, forecast or other information supplied. You should always seek independent advice as to your suitability to speculate in any related markets and your ability to assume the associated risks, if you are at all unsure. We are not under any obligation to update any such material. Any opinion made may be personal to the author and may not reflect the opinion of StoneX Europe Ltd.