



Nikkei 225 Outlook: AI Bulls Face Another Crucial Test
The Nikkei 225 remains under pressure after a sharp decline, but today's reaction to weaker-than-expected SK Hynix earnings may prove more important than the results themselves. If AI stocks refuse to fall on bad news, the ingredients may be in place for a tactical bear squeeze.
Share this:

- SK Hynix earnings disappoint lofty market expectations
- Nikkei 225 consolidating after heavy selling
- Bearish momentum shows early signs of fading
- Bad news already reflected in prices?
SK Hynix Delivers Latest AI Sentiment Test
The Nikkei 225 has been taken to the woodshed in recent sessions, accelerating an already well-established bearish trend. Today, the bears get another opportunity to press their advantage after South Korean AI memory chip giant SK Hynix delivered what, relative to extremely lofty market expectations, looks like a bearish earnings report.
The question is whether the price action obliges across Asia.
SK Hynix reported record Q2 operating profit of 60.5 trillion won and revenue of 79.3 trillion won, up more than six-fold and 257% from a year earlier, respectively. However, operating profit fell short of the 64 trillion won expected by analysts, delivering exactly the type of outcome that would normally weigh on AI-linked stocks, especially given recent concerns surrounding hyperscaler capex and returns on investment.
If SK Hynix, the broader KOSPI and AI-linked names across Asia refuse to break lower on the earnings update, traders should take notice. Markets that stop falling on bearish news often tell you something about positioning and sentiment. It can be a sign bears are running out of ammunition, especially after the heavy selling seen across the sector over the past month.
That's where the technical picture for the Nikkei 225 becomes interesting.
Will the Market Oblige?
Source: TradingView
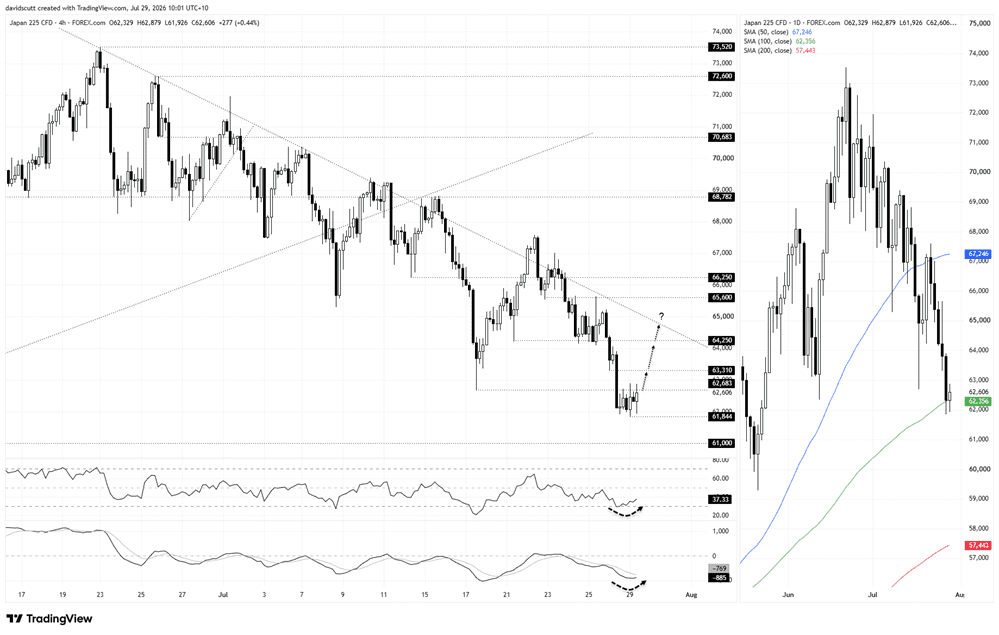
The price has stopped making fresh lows for now on the four hourly time frame, consolidating between the July 17 low of 62,683 overhead and Monday’s low of 61,844. The 100-day simple moving average, shown in the pane on the right, is also found around 62,350, making this an interesting zone for setups.
With RSI (14) setting a higher high, suggesting bearish momentum may be starting to turn, while MACD is starting to converge on the signal line while holding in negative territory, there's enough there to keep bulls interested.
Combined with thin pre-Fed liquidity and looming hyperscaler capex updates from the likes of Meta and Microsoft, it looks like a decent setup for a bear hunt.
Normally, renewed hostilities in the Middle East, as we've seen earlier today, wouldn't be a backdrop I'd associate with Nikkei upside. But that's not how this conflict has traded during the conflict. When tensions have escalated, AI-related stocks have generally outperformed relative to cyclicals, suggesting the latest headlines need not scupper the setup.
If we see the price break above 62,683 and hold there, longs could be set with a tight stop beneath for protection, targeting 63,310 initially, followed by 64,250. Beyond there, the June downtrend comes into play just above 65,000 today, marking the ultimate upside target for the trade. I'd struggle to justify expecting anything beyond that given the prevailing trend.
As this is a tactical long setup that goes completely against the prevailing bearish trend, capital protection is paramount. Blindly buying the dip is asking for trouble.
Should the price break convincingly beneath 61,844 instead, the bullish setup would be null and void, pointing instead to an extension of the prevailing bearish trend that may see a further unwind towards support at 61000.
Latest market news




The complete CFD trading experience
Award-winning platforms, competitive spreads, low commissions and dedicated support.
We live and breathe the markets and are dedicated to helping traders realise their ambitions as we continue to set the industry bar.
Economic calendar
Web Trader platform
Our sophisticated web-based platform is packed with features.
Related articles
Canadian Dollar Short-term Outlook: USD/CAD Five-Week Rally Hits a Wall at Major Resistance 10 14 2026
USD/CAD is holding near fresh yearly highs, but bearish divergence and a well-defined October range raise the stakes at major resistance.


USD/JPY forecast: hot US CPI lifts the pair above its 200-day average
Hotter-than-expected US inflation has pushed USD/JPY above its 200-day moving average, putting 160 and the risk of Bank of Japan intervention back in focus. The breakout still needs to hold, and a failure could send the pair sharply lower.


Australian Dollar Technical Outlook: AUD/USD Trend Break Faces Immediate Test 10 14 2026
AUD/USD is trying to hold a fresh trend break as renewed selling pressure tests whether the recovery can extend beyond the recent rebound.
StoneX Europe Ltd may make third party material available on this website which may contain information included but not limited to the conditions of financial markets. The material is for information purposes only and does not contain, and should not be construed as containing, investment advice and/or investment recommendation and/or an investment research and/or an offer of or solicitation for any transactions in financial instruments; any decision to enter into a specific transaction shall be made by the client following an assessment by him/her of their situation.
StoneX Europe Ltd makes no representation or warranty and assumes no liability as to the accuracy or completeness of the information provided, nor any loss arising from any investment based on a recommendation, forecast or other information supplied. You should always seek independent advice as to your suitability to speculate in any related markets and your ability to assume the associated risks, if you are at all unsure. We are not under any obligation to update any such material. Any opinion made may be personal to the author and may not reflect the opinion of StoneX Europe Ltd.