






Norwegian Krone not Playing Fair
If USD/NOK rolls over, it will have proved correct and the move lower in crude was a bit overdone!
Share this:

With the collapse in oil prices since the beginning of the week, we have looked at a few currency pairs and what we can expected from them, including the USD/CAD and the USD/MXN. The Norwegian Krone is an additional currency to be aware of, as Norway is also a large oil exporting country and the Krone is likely to be affected by the move in oil (among other things).
Before the outbreak of the coronavirus, the Norges Bank had been increasing rates throughout late 2018 and 2019 as Norway’s economy was holding up well amid a global manufacturing slowdown. However, as the coronavirus began to spread, the Norges Bank slashed rates from 1.5% to 1.0% on March 13th. A week later, on March 20th, they cut an additional 75bps to 0.25% as the world came to a near standstill and liquidity dried up (just as most of the world had done).
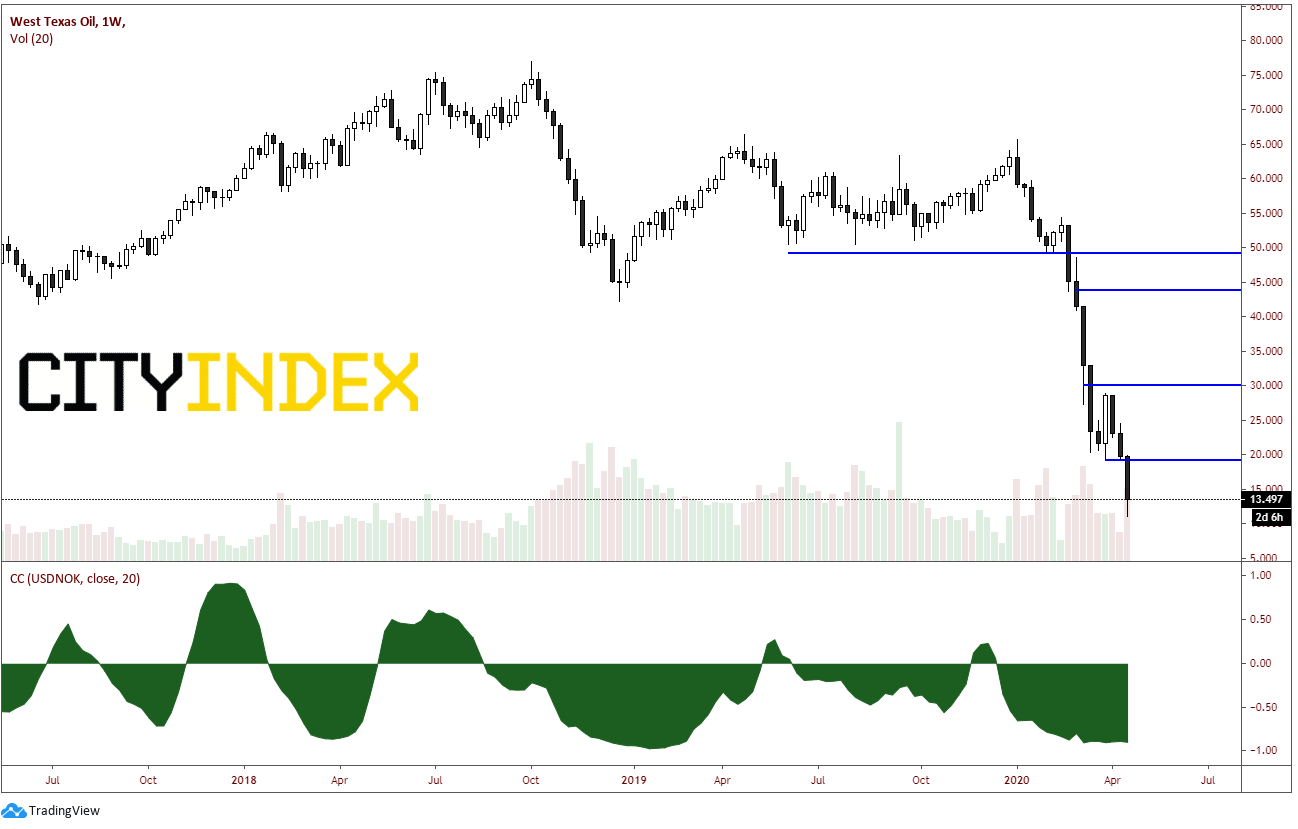
Enter crude oil and the collapse in prices over the last month. The correlation coefficient on a weekly timeframe between West Texas Crude Oil (WTI) and USD/NOK is -0.90. This means that 90% of the time, the Norwegian Krone and WTI move together (or 90% of the time, USD/NOK and WTI trade inversely).
Source: Tradingveiw, City Index
On a daily timeframe, USD/NOK traded higher as crude oil sold of due the Russia/OPEC squabble, in which Russia refused to cut output with the rest of OPEC. As a result, there was no agreement to the production cut, and Saudi Arabia began producing a full throttle. However, as WTI began consolidating in the 20-30 US Dollar range, USD/NOK pulled back to the 61.8% Fibonacci retracement level from the March 3rd lows to the march 19th highs. On Monday, when the May WTI Crude oil contract traded was down over 200%, USD/NOK only moved higher 1.25%. On Tuesday, the June WTI Crude oil contract traded down 50%, USD/NOK was only up 1.81%. And today, as June contract is up 5.81%, USD/NOK is up 1.3% (in the opposite direction one would expect!)
Source: Tradingveiw, City Index
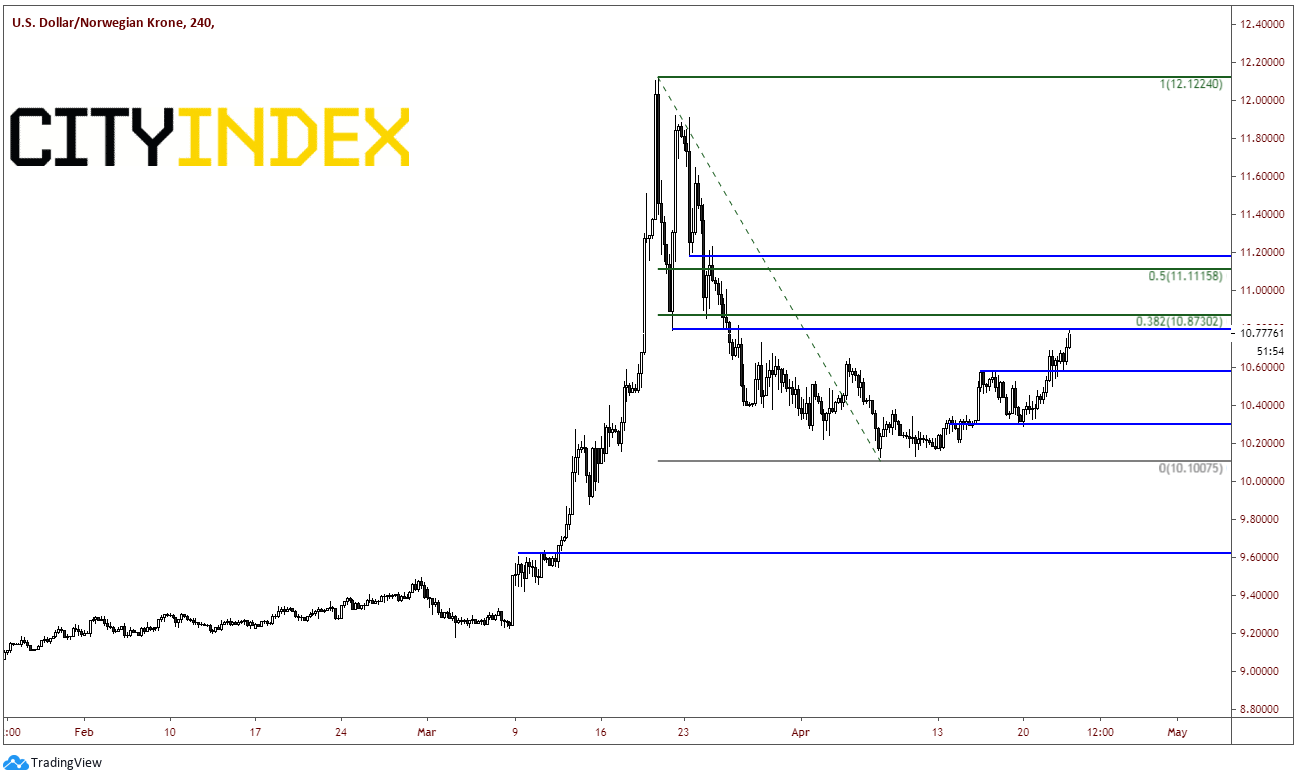
However, on a 240-minute timeframe, notice where USD/NOK is trading: right up against horizontal resistance at 10.77 and just below the 38.2% Fibonacci retracement level from the March 19th highs to the April 7th lows, near 10.8730. If price breaks through, there is horizonal resistance and the 50% retracement from the same period at 10.8730. Horizontal support levels are at 10.4688 and 10.2857, and then the April 7th lows near 10.1000.
Source: Tradingveiw, City Index
Although WTI Crude Oil may have been trading a but heavy as of late, USD/NOK isn’t believing it, at least in the short-term. However, the bounce in USD/NOK appears to be corrective with good resistance above. If USD/NOK does roll back over, it will have proved correct, and the move lower in crude was just a bit overdone!
With the collapse in oil prices since the beginning of the week, we have looked at a few currency pairs and what we can expected from them, including the USD/CAD and the USD/MXN. The Norwegian Krone is an additional currency to be aware of, as Norway is also a large oil exporting country and the Krone is likely to be affected by the move in oil (among other things).
Before the outbreak of the coronavirus, the Norges Bank had been increasing rates throughout late 2018 and 2019 as Norway’s economy was holding up well amid a global manufacturing slowdown. However, as the coronavirus began to spread, the Norges Bank slashed rates from 1.5% to 1.0% on March 13th. A week later, on March 20th, they cut an additional 75bps to 0.25% as the world came to a near standstill and liquidity dried up (just as most of the world had done).
Enter crude oil and the collapse in prices over the last month. The correlation coefficient on a weekly timeframe between West Texas Crude Oil (WTI) and USD/NOK is -0.90. This means that 90% of the time, the Norwegian Krone and WTI move together (or 90% of the time, USD/NOK and WTI trade inversely).
Source: Tradingveiw, FOREX.com
On a daily timeframe, USD/NOK traded higher as crude oil sold of due the Russia/OPEC squabble, in which Russia refused to cut output with the rest of OPEC. As a result, there was no agreement to the production cut, and Saudi Arabia began producing a full throttle. However, as WTI began consolidating in the 20-30 US Dollar range, USD/NOK pulled back to the 61.8% Fibonacci retracement level from the March 3rd lows to the march 19th highs. On Monday, when the May WTI Crude oil contract traded was down over 200%, USD/NOK only moved higher 1.25%. On Tuesday, the June WTI Crude oil contract traded down 50%, USD/NOK was only up 1.81%. And today, as June contract is up 5.81%, USD/NOK is up 1.3% (in the opposite direction one would expect!)
Source: Tradingveiw, FOREX.com
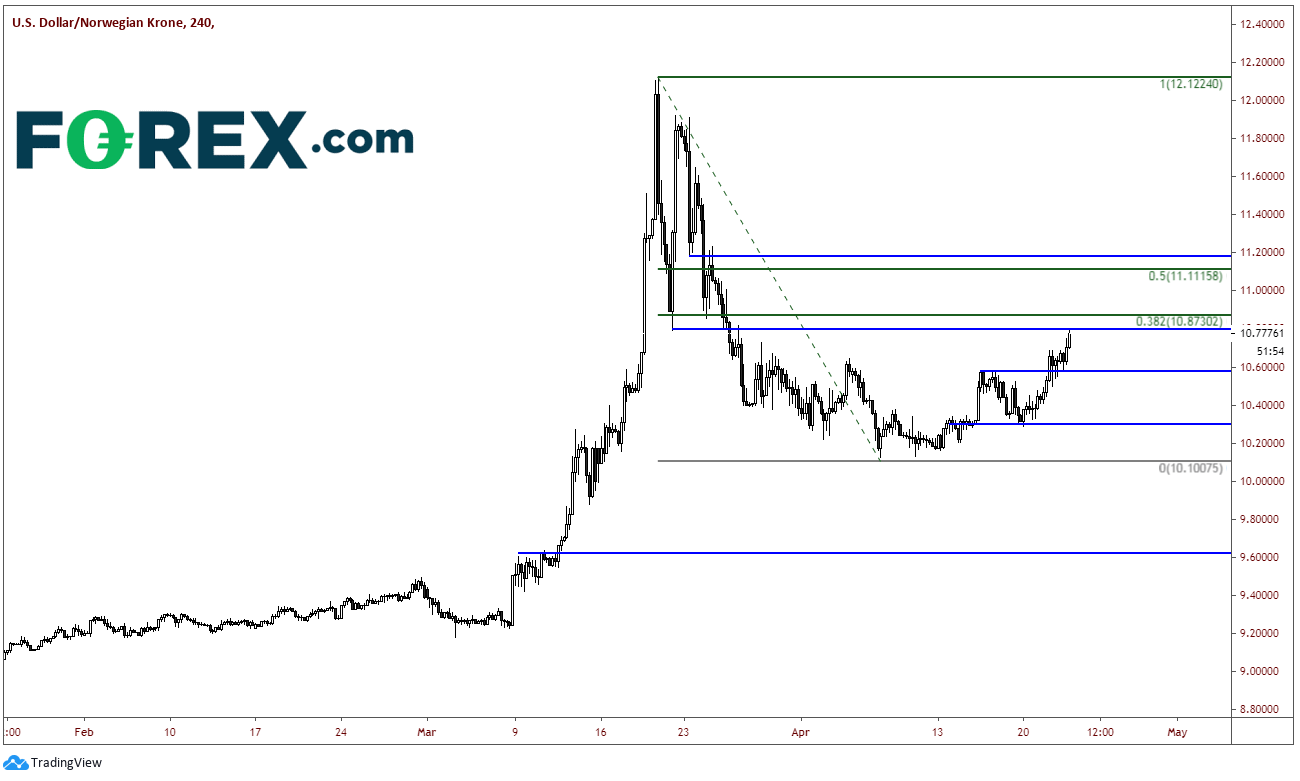
However, on a 240-minute timeframe, notice where USD/NOK is trading: right up against horizontal resistance at 10.77 and just below the 38.2% Fibonacci retracement level from the March 19th highs to the April 7th lows, near 10.8730. If price breaks through, there is horizonal resistance and the 50% retracement from the same period at 10.8730. Horizontal support levels are at 10.4688 and 10.2857, and then the April 7th lows near 10.1000.
Source: Tradingveiw, FOREX.com
Although WTI Crude Oil may have been trading a but heavy as of late, USD/NOK isn’t believing it, at least in the short-term. However, the bounce in USD/NOK appears to be corrective with good resistance above. If USD/NOK does roll back over, it will have proved correct, and the move lower in crude was just a bit overdone!
Latest market news




The complete CFD trading experience
Award-winning platforms, competitive spreads, low commissions and dedicated support.
We live and breathe the markets and are dedicated to helping traders realise their ambitions as we continue to set the industry bar.
Economic calendar
Web Trader platform
Our sophisticated web-based platform is packed with features.
Related articles
EUR/USD weekly outlook: Oil, inflation and NFP in focus
After coming under significant pressure in recent weeks, the EUR/USD came off its lows to finish the week on a positive note on Friday, albeit with only a mild rebound. That was not enough to prevent the exchange rate falling for the third consecutive week, as the US dollar and bond yields rallied across the board.


EUR/USD Q4 2026 Outlook: Euro at a Crossroads as Fed, ECB Tighten 9 25 2026
EUR/USD enters Q4 at a pivotal inflection point as competing Fed-ECB policy paths and persistent inflation risks collide with major technical support.


USD/JPY Q4 2026 Outlook: Hawkish Fed Pricing Clashes With Intervention Risk
The year-end tug-of-war is clear: hawkish Fed pricing supports USD/JPY, while intervention risk limits the upside.

StoneX Europe Ltd may make third party material available on this website which may contain information included but not limited to the conditions of financial markets. The material is for information purposes only and does not contain, and should not be construed as containing, investment advice and/or investment recommendation and/or an investment research and/or an offer of or solicitation for any transactions in financial instruments; any decision to enter into a specific transaction shall be made by the client following an assessment by him/her of their situation.
StoneX Europe Ltd makes no representation or warranty and assumes no liability as to the accuracy or completeness of the information provided, nor any loss arising from any investment based on a recommendation, forecast or other information supplied. You should always seek independent advice as to your suitability to speculate in any related markets and your ability to assume the associated risks, if you are at all unsure. We are not under any obligation to update any such material. Any opinion made may be personal to the author and may not reflect the opinion of StoneX Europe Ltd.