



Nvidia pulls back; may be ready to crack
If the Fed aggressively increases interest rates over the next 2 years, the present value of Nvidia’s future value will continue to fall, and thus, so should the stock price.
Share this:

According to our in-house data, Nvidia (NVDA) is one of our most widely trade stocks. So, when the price began to pull back from all-time highs at 346.47 in late November 2021, many traders may have been wondering why. First, as with so many other stocks, price moved lower on November 26th, 2021 as the Omicron variant of the coronavirus came to light. Price continued to fall to 272.50 over the course of the next 2 weeks, a plunge of over 21% on December 14th, 2021! NVDA’s price then bounced into the FOMC meeting.
Big Tech stocks: What will they face in 2022?
What happened next had to do more with the FOMC and less with the Omicron variant (although the coronavirus was the root cause for almost all stock price moves since March 2020). At the December meeting, the FOMC surprised markets with its hawkish tone! Members discussed increasing the pace of bond purchases and forecasted 3 interest rate increases for 2022 and 3 interest rate increases for 2023! Nvidia is a monster semiconductor company which trades at a high valuation because its prospects for future growth/profits are high. However, if interest rates rise, the present value of those future profits falls, and so does that price of NVDA stock.
Central Banks: Liftoff in Focus?
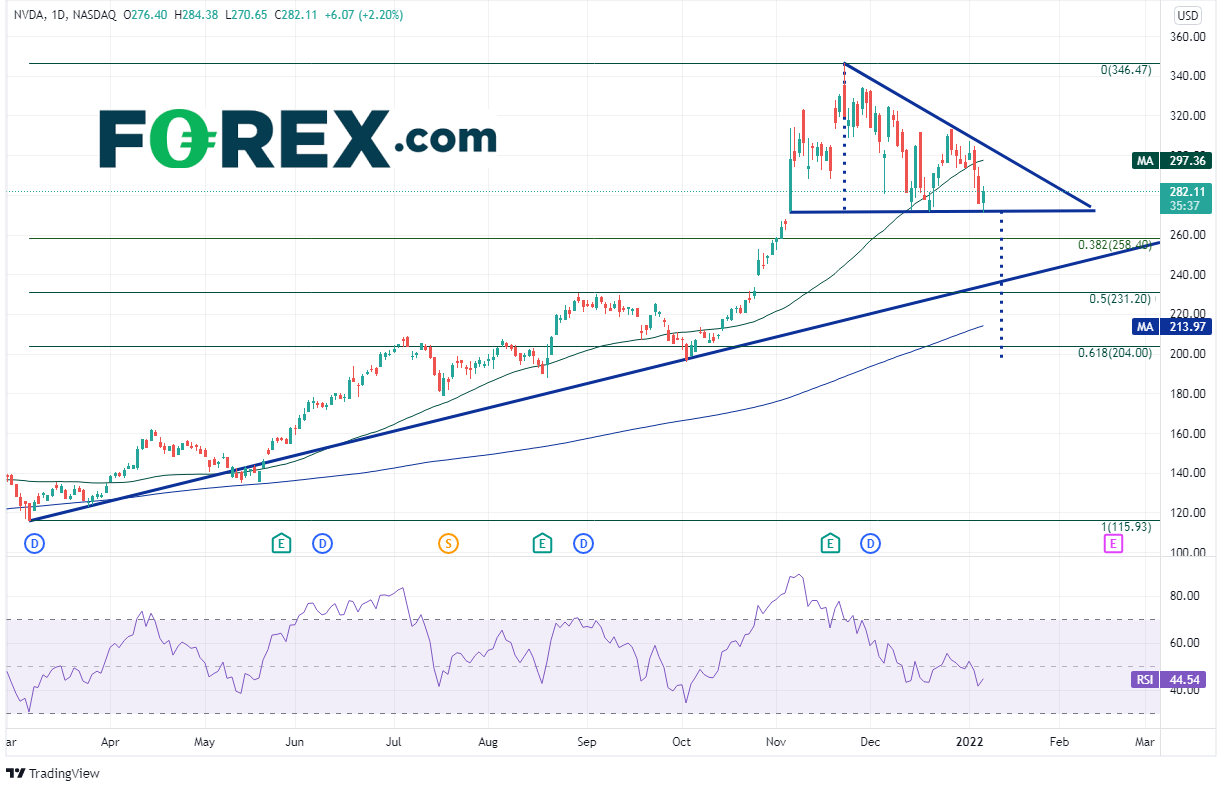
As a result of more hawkish Fed, the markets were spooked and the price of NDVA moved lower t0 271.45. Price tried to bounce, but with the more hawkish Fed minutes yesterday, price again tested the near-term lows at 275.33. The series of lower highs and the testing of the lows has set up a falling triangle. Expectations are that price will break lower out of the falling triangle, which is often seen as a topping pattern. The target, once price breaks lower, is the height of the pattern added to the breakdown point. In this case, the target is near 200.00 and near the 61.8% Fibonacci retracement level from the lows of March 8th, 2021 to the highs of November 22nd, 2021.
Source: Tradingview, Stone X
Trade NVDA now: Login or open a new account!
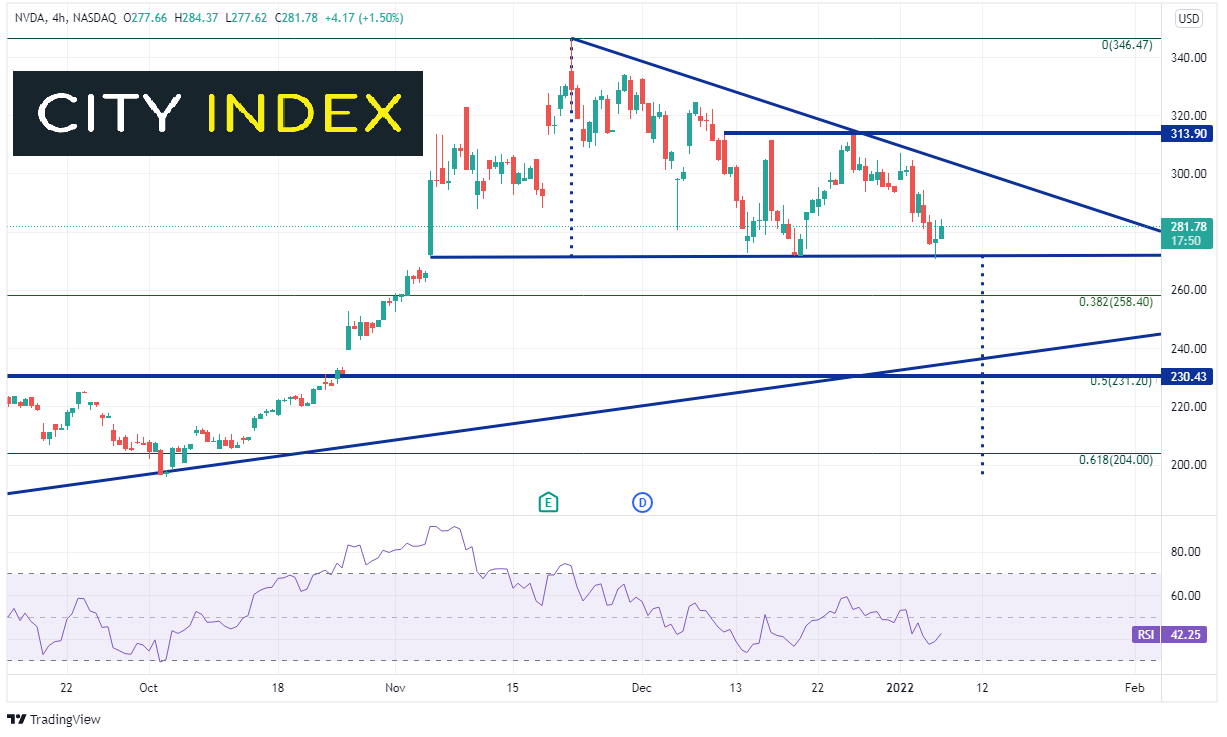
On a 240- minute timeframe, if price breaks below horizontal support at 270, it could fall to fill the gap from November 3rd, 2021 at 266.57 and then the 38.2% Fibonacci retracement from the lows on March 8th, 2021 to the highs of November 22nd, 2021 near 258.40. Below there is an upward sloping trendline dating back to March 8th, 2021 near 237. After that is a confluence of support at a gap fill, horizontal support and the 50% retracement from the previously mentioned timeframe near 230/233. Resistance is at the downward sloping trendline from the top of the triangle near 303.50. Above there is horizontal resistance at 313.90 and then the all-time highs at 346.47.

Source: Tradingview, Stone X
If the Fed aggressively increases interest rates over the next 2 years, the present value of Nvidia’s future value will continue to fall, and thus, so should the stock price. And if the stock breaks horizontal support near 270, it could be on its way to the topping pattern target near 200!
Learn more about equity trading opportunities.
According to our in-house data, Nvidia (NVDA) is one of our most widely trade stocks. So, when the price began to pull back from all-time highs at 346.47 in late November 2021, many traders may have been wondering why. First, as with so many other stocks, price moved lower on November 26th, 2021 as the Omicron variant of the coronavirus came to light. Price continued to fall to 272.50 over the course of the next 2 weeks, a plunge of over 21% on December 14th, 2021! NVDA’s price then bounced into the FOMC meeting.
Big Tech stocks: What will they face in 2022?
What happened next had to do more with the FOMC and less with the Omicron variant (although the coronavirus was the root cause for almost all stock price moves since March 2020). At the December meeting, the FOMC surprised markets with its hawkish tone! Members discussed increasing the pace of bond purchases and forecasted 3 interest rate increases for 2022 and 3 interest rate increases for 2023! Nvidia is a monster semiconductor company which trades at a high valuation because its prospects for future growth/profits are high. However, if interest rates rise, the present value of those future profits falls, and so does that price of NVDA stock.
Central Banks: Liftoff in Focus?
As a result of more hawkish Fed, the markets were spooked and the price of NDVA moved lower t0 271.45. Price tried to bounce, but with the more hawkish Fed minutes yesterday, price again tested the near-term lows at 275.33. The series of lower highs and the testing of the lows has set up a falling triangle. Expectations are that price will break lower out of the falling triangle, which is often seen as a topping pattern. The target, once price breaks lower, is the height of the pattern added to the breakdown point. In this case, the target is near 200.00 and near the 61.8% Fibonacci retracement level from the lows of March 8th, 2021 to the highs of November 22nd, 2021.

Source: Tradingview, Stone X
Trade NVDA now: Login or Open a new account!
• Open an account in the UK
• Open an account in Australia
• Open an account in Singapore
On a 240- minute timeframe, if price breaks below horizontal support at 270, it could fall to fill the gap from November 3rd, 2021 at 266.57 and then the 38.2% Fibonacci retracement from the lows on March 8th, 2021 to the highs of November 22nd, 2021 near 258.40. Below there is an upward sloping trendline dating back to March 8th, 2021 near 237. After that is a confluence of support at a gap fill, horizontal support and the 50% retracement from the previously mentioned timeframe near 230/233. Resistance is at the downward sloping trendline from the top of the triangle near 303.50. Above there is horizontal resistance at 313.90 and then the all-time highs at 346.47.
Source: Tradingview, Stone X
If the Fed aggressively increases interest rates over the next 2 years, the present value of Nvidia’s future value will continue to fall, and thus, so should the stock price. And if the stock breaks horizontal support near 270, it could be on its way to the topping pattern target near 200!
Learn more about equity trading opportunities.
Related tags:
Latest market news




The complete CFD trading experience
Award-winning platforms, competitive spreads, low commissions and dedicated support.
We live and breathe the markets and are dedicated to helping traders realise their ambitions as we continue to set the industry bar.
Economic calendar
Web Trader platform
Our sophisticated web-based platform is packed with features.
Related articles
AUD/USD outlook: Aussie slips despite hawkish RBA ahead of key data
The AUD/USD was unable to benefit from the Reserve Bank of Australia’s 25-basis-point rate hike overnight. The RBA lifted the cash rate to 4.60%, in line with expectations. However, the Australian dollar weakened following the decision, with much of the Bank’s hawkish stance seemingly priced in ahead of the announcement. The US dollar has also remained largely supported following the recent turmoil in the bond markets.


RBA delivers 25bp hike, Bullock now the main event
The RBA delivered the expected 25bp hike, but Bullock’s press conference now looms as the bigger volatility risk for AUD/USD and the ASX 200.


Gold outlook: XAU/USD hammered, stretched and vulnerable to a sharp rebound
Gold is getting hammered for solid fundamental reasons, but history suggests extreme four-hourly oversold conditions can produce violent countertrend rallies.
StoneX Europe Ltd may make third party material available on this website which may contain information included but not limited to the conditions of financial markets. The material is for information purposes only and does not contain, and should not be construed as containing, investment advice and/or investment recommendation and/or an investment research and/or an offer of or solicitation for any transactions in financial instruments; any decision to enter into a specific transaction shall be made by the client following an assessment by him/her of their situation.
StoneX Europe Ltd makes no representation or warranty and assumes no liability as to the accuracy or completeness of the information provided, nor any loss arising from any investment based on a recommendation, forecast or other information supplied. You should always seek independent advice as to your suitability to speculate in any related markets and your ability to assume the associated risks, if you are at all unsure. We are not under any obligation to update any such material. Any opinion made may be personal to the author and may not reflect the opinion of StoneX Europe Ltd.