



NZD/USD Forecast: When Oil and Yields Align, the Kiwi Declines
Risk appetite has turned, oil has spiked and Fed pricing has shifted. NZD/USD has responded with a sharp technical break, leaving bulls clinging to trend support as U.S. data risk looms.
Share this:

- Oil surge and trimmed Fed cuts fuel broad dollar strength
- Correlations show risk appetite, not rates, driving flows
- 200DMA and November uptrend now pivotal support
- Break lower exposes the 0.5700 region
When Energy Risk Becomes Currency Risk
As a nation with a heavy dependence on fossil fuel imports, New Zealand sits among the major economic casualties from energy supply disruptions stemming from the lengthening conflict between Iran, the US and regional neighbours. And, as a small open economy closely tied to the performance of China, the world’s largest energy importer, it comes as little surprise the Kiwi dollar has been among the hardest hit G10 FX currencies so far this week. With a strengthening link to souring risk appetite, it’s been hammered, combining with bearish technical signals to spark a significant unwind from multi-month highs.
However, while headlines tied to the conflict are likely to remain the dominant driver of NZD/USD in the near term, major U.S. economic data is fast approaching, adding another layer of complexity and raising the risk of even greater volatility.
Risk Appetite Takes Control
Source: TradingView
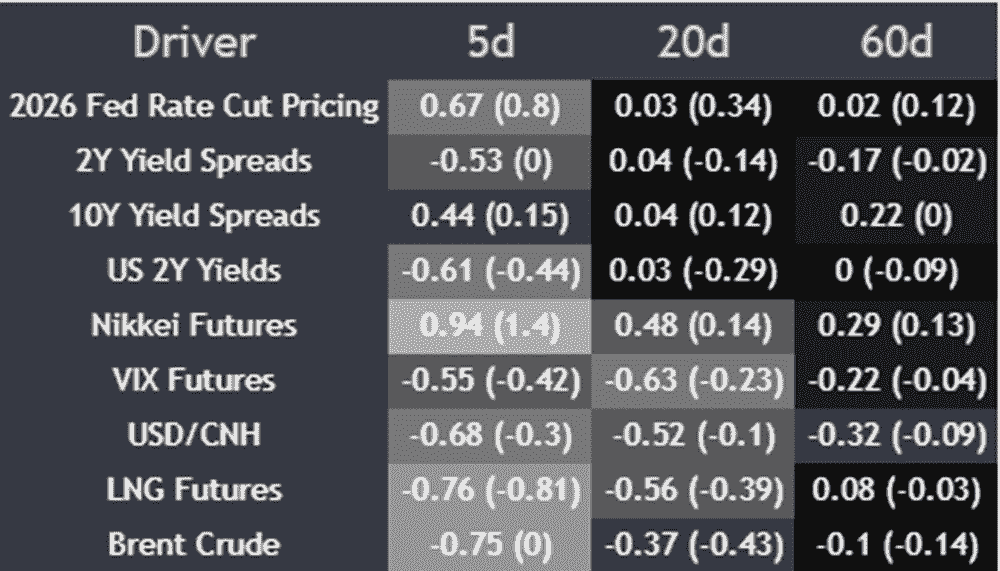
The correlation matrix above tells you everything you need to know about what’s been influencing the Kiwi in recent days. With a 0.94 positive relationship with Nikkei futures, used as a proxy for regional risk appetite given it often leads other Asian markets, it’s clear sentiment has been the dominant driver. That influence has even exceeded the impact of surging energy prices, reflected in the strengthening negative correlation with Brent and LNG futures over the past week, along with moves in rate differentials led primarily by U.S. Treasuries.
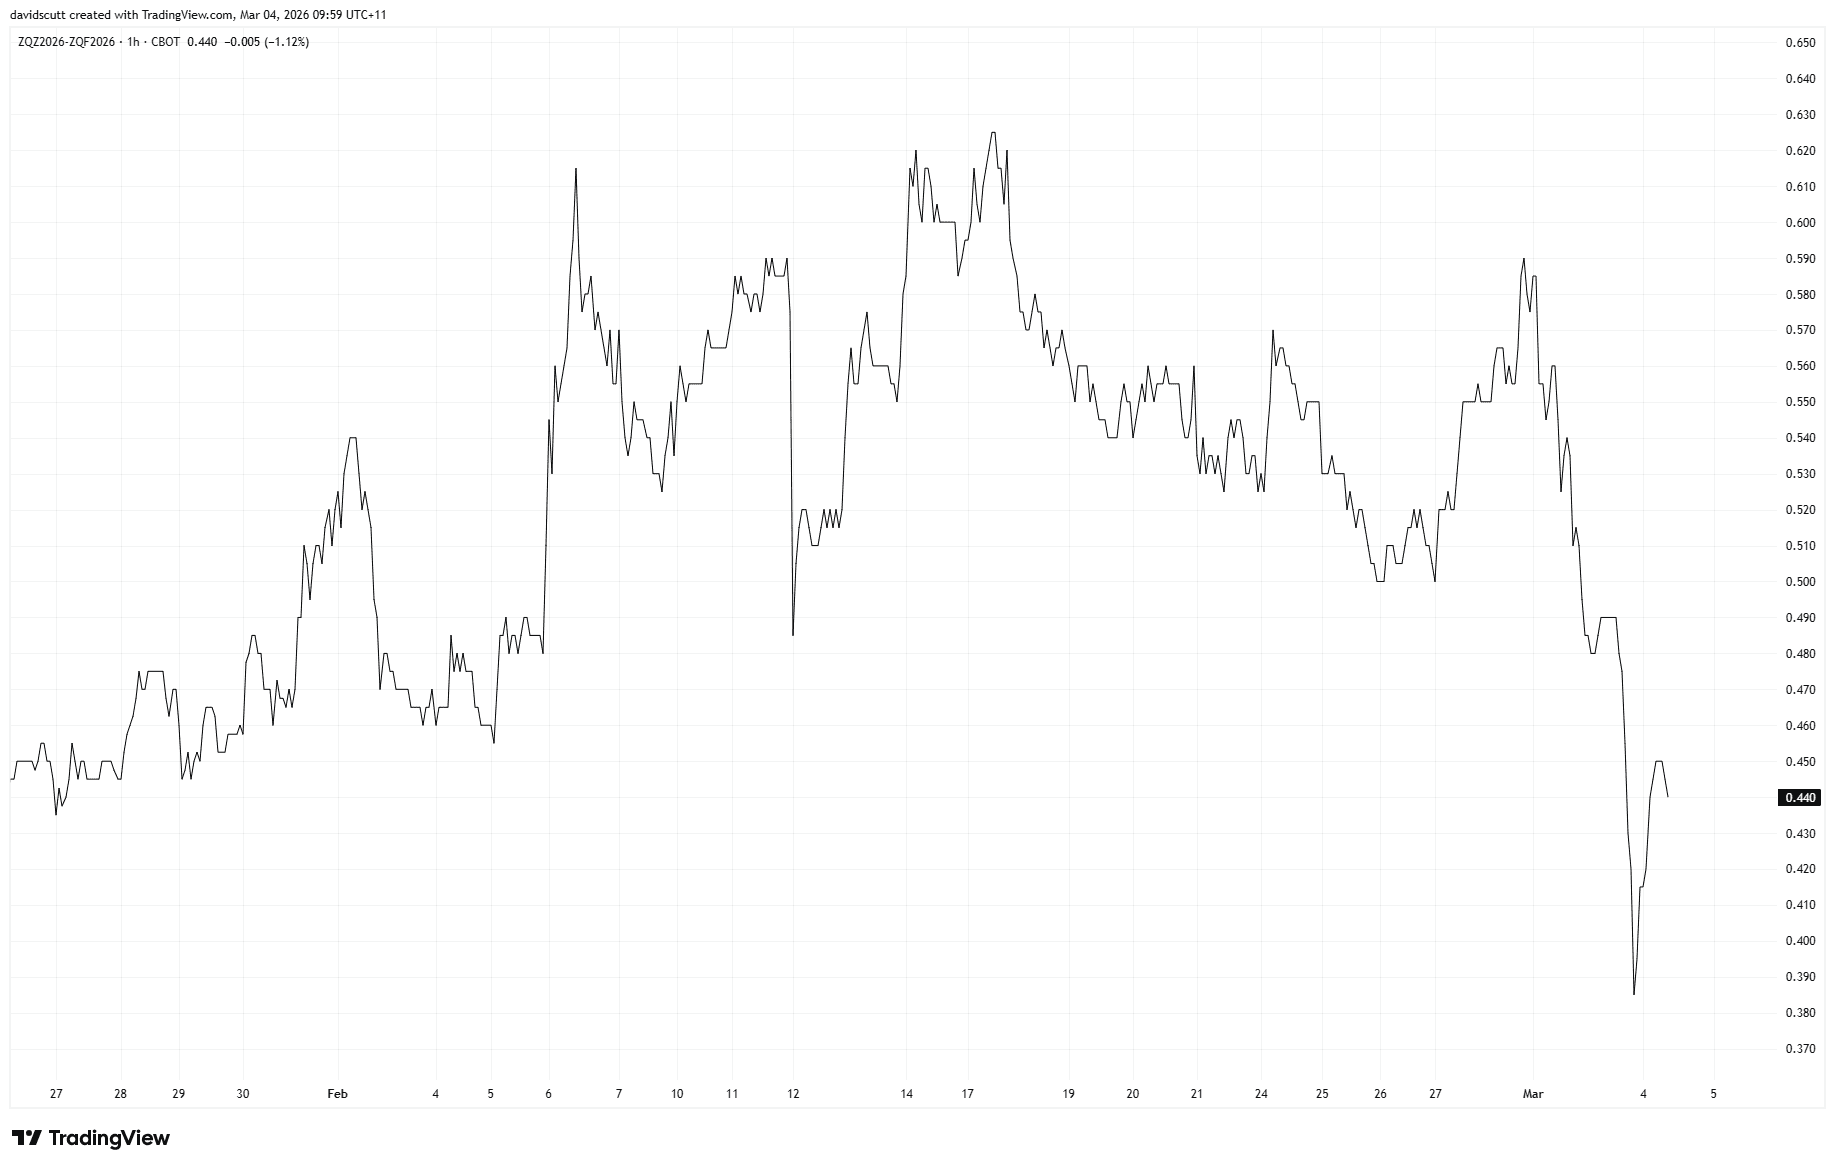
While the matrix shows only a modest relationship between NZD/USD and Fed rate cut pricing or short-dated yield differentials, rates have still leaned against the Kiwi at the margin. Fed funds futures now price just 44 basis points of easing this year, around 15bp less than at the start of the week. That shift, combined with the U.S. energy security advantage amid the Middle East escalation, has helped fuel broad dollar strength.
Source: TradingView
The Data Gauntlet Begins
But with key U.S. economic data now coming into view, the dollar move may not be linear. Concerns that surfaced late last week around private equity asset quality, bank exposure and potential AI-driven disruption risk shifting the focus back to U.S. growth and Fed expectations.
Source: TradingView
Monday’s ISM manufacturing report, which exceeded forecasts, helped to temporarily ease fears of a sharper slowdown. The focus now turns to whether that resilience extends beyond the factory sector.
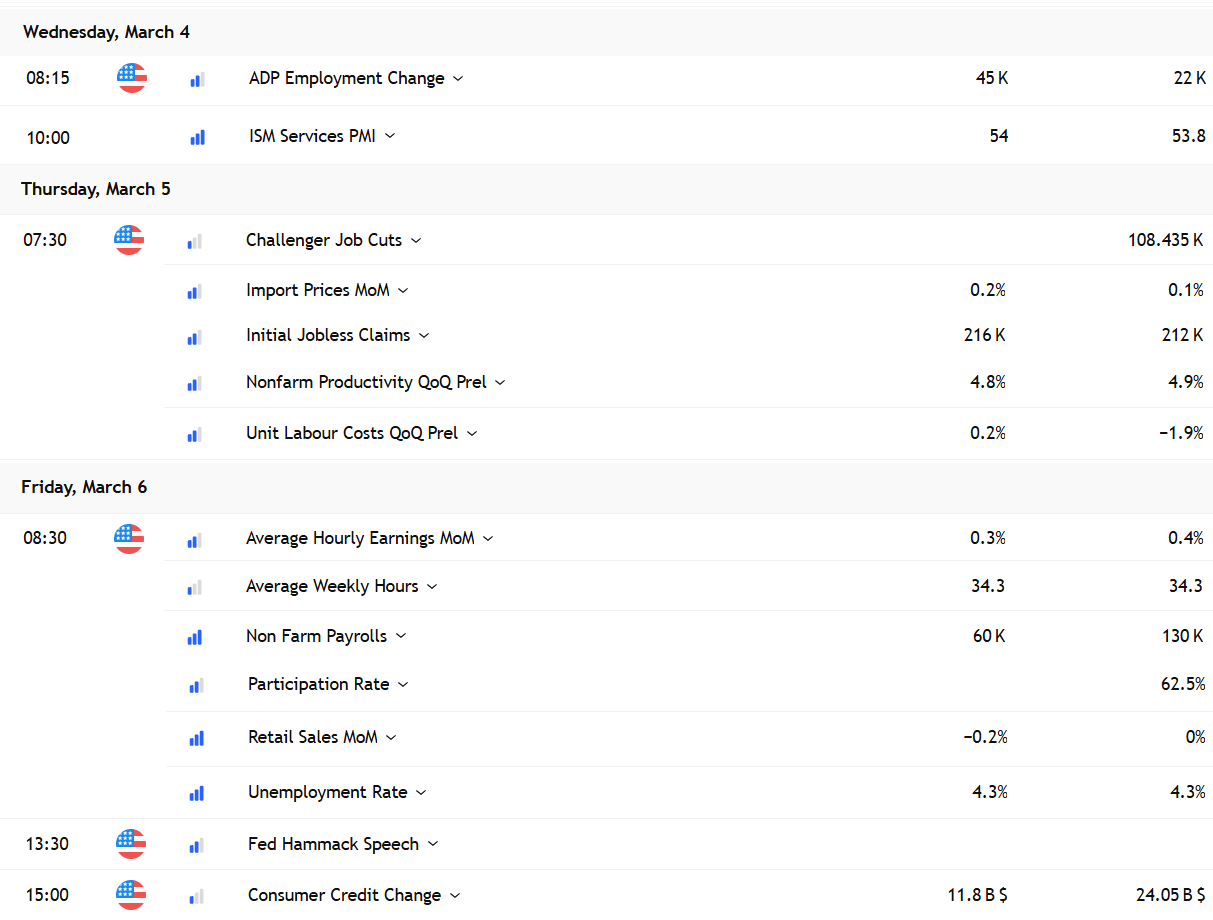
Today’s ADP report and ISM services PMI will take centre stage, with markets focused squarely on employment and new orders rather than price components. Any softening in hiring intentions would reinforce the bond market’s caution, particularly given concerns around AI-driven displacement of white-collar workers.
Challenger job cuts, productivity and unit labour cost data later in the week will provide further colour, before the real test arrives on Friday with non-farm payrolls and retail sales. In the current backdrop, solid data would likely steady risk appetite, while disappointment could quickly revive slowdown fears and reprice Fed expectations.
For the Kiwi, the outcome may be negative regardless of whether the data impresses or whiffs. Strong data could further widen the dollar’s yield advantage. Weak data, while normally supportive, risks triggering fresh weakness in riskier asset classes and an uptick in volatility, both traditional headwinds for the flightless bird. The market reaction may therefore prove more important than the data itself.
200DMA Becomes the Battleground
Source: TradingView
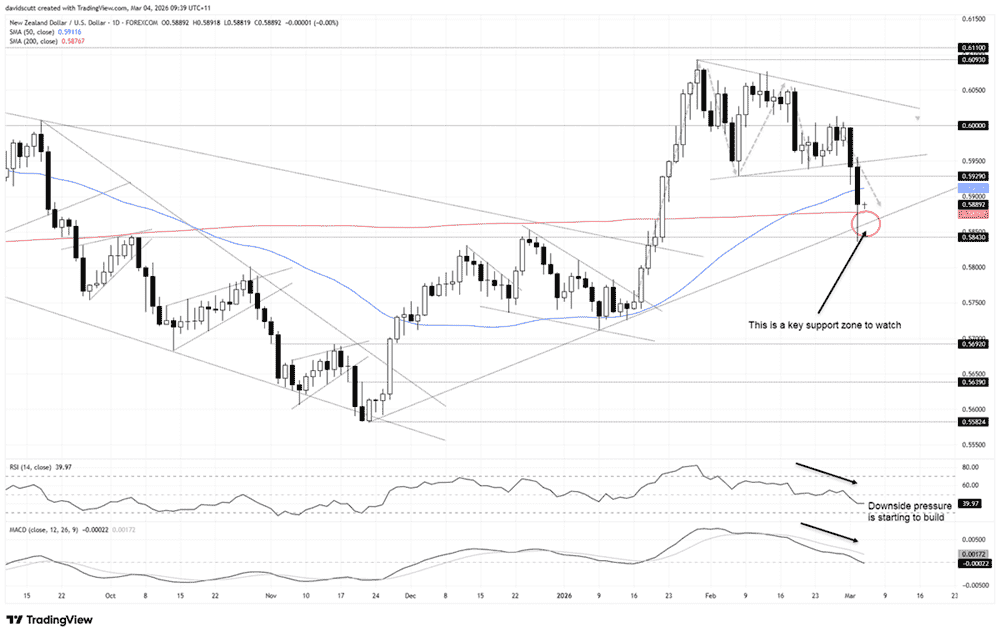
A few things stand out on the daily chart. After breaking to fresh multi-month highs in January, NZD/USD had been coiling within a bull pennant. Rather than extending the broader uptrend, we’ve seen a downside break, with the pair looking increasingly heavy since the RBNZ decision in mid-February.
The pair repeatedly struggled above 0.6000, and geopolitical headlines overwhelmed bulls who had been buying dips towards pennant support prior to the conflict. Tuesday’s breakdown has inflicted notable damage on the bullish case, although price managed to reclaim the 200-day moving average after briefly trading beneath it.
Importantly, it also bounced from the intersection of horizontal support at 0.5843 and the November 2025 uptrend, validating that trendline for now. The bulls haven’t been defeated, but directional risks look far more balanced than a month ago. RSI (14) had been carving lower highs before slipping below 50, while MACD has flipped negative after crossing below its signal line.
Downside pressure is therefore building, keeping a retest of the 200DMA and November uptrend in play. A clean break would undermine the broader bullish structure, tilting risks lower with little obvious technical support until around 0.5700.
If the 200DMA and uptrend hold, 0.5929 marks the origin of the breakdown and may now act as resistance. Former pennant support sits just above 0.5950, followed by the 0.6000 barrier.
Latest market news



The complete CFD trading experience
Award-winning platforms, competitive spreads, low commissions and dedicated support.
We live and breathe the markets and are dedicated to helping traders realise their ambitions as we continue to set the industry bar.
Economic calendar
Web Trader platform
Our sophisticated web-based platform is packed with features.
Related articles
Gold Q4 2026 outlook: Resilience in the face of rallying dollar and yields
As we headed towards the latter stages of Q3 and into Q4, the Fed had just hiked rates in a hawkish FOMC meeting, while the likes of the ECB and BoJ had also tightened their respective policies. Oil prices remained elevated amid the prolonged US-Iran conflict. Meanwhile, bond yields were breaking out, and the dollar was higher across the board. Yet, remarkably, gold was still holding in the positive territory for the third quarter, even if it had weakened somewhat in September.

EUR/USD Q4 2026 Outlook: Euro at a Crossroads as Fed, ECB Tighten 9 25 2026
EUR/USD enters Q4 at a pivotal inflection point as competing Fed-ECB policy paths and persistent inflation risks collide with major technical support.


USD/JPY Q4 2026 Outlook: Hawkish Fed Pricing Clashes With Intervention Risk
The year-end tug-of-war is clear: hawkish Fed pricing supports USD/JPY, while intervention risk limits the upside.
StoneX Europe Ltd may make third party material available on this website which may contain information included but not limited to the conditions of financial markets. The material is for information purposes only and does not contain, and should not be construed as containing, investment advice and/or investment recommendation and/or an investment research and/or an offer of or solicitation for any transactions in financial instruments; any decision to enter into a specific transaction shall be made by the client following an assessment by him/her of their situation.
StoneX Europe Ltd makes no representation or warranty and assumes no liability as to the accuracy or completeness of the information provided, nor any loss arising from any investment based on a recommendation, forecast or other information supplied. You should always seek independent advice as to your suitability to speculate in any related markets and your ability to assume the associated risks, if you are at all unsure. We are not under any obligation to update any such material. Any opinion made may be personal to the author and may not reflect the opinion of StoneX Europe Ltd.