



Oil, Dax Forecast: Two trades to watch
Oil extends gains on fears of renewed US-Iran military tensions. DAX falls as oil prices and inflation worries rise.
Share this:



Oil extends gains on fears of renewed US-Iran military tensions
Oil prices are rising on Monday, extending the 10% gains from last week amid rising geopolitical tensions.
President Trump warned Iran that the clock is ticking and that there “won’t be anything left” if there is no progress soon in the stalled U.S.-Iran talks. Furthermore, reports suggest that Israel and the U.S. are actively advancing military preparations to resume attacks against Iran. This raises the risk of further escalation in the Middle East, boosting crude oil prices.
Talks between the U.S. and Iran have failed to progress owing to disagreements over Tehran’s nuclear programme.
The Strait of Hormuz also remains effectively closed, while inventories are being drained at the fastest pace outside a major emergency, raising supply concerns.
There is a growing sense since last week that traders have stopped waiting for a deal, and the market is becoming increasingly concerned over the lack of a resolution.
Meanwhile, a firmer U.S. dollar could cap the upside for crude oil prices. The dollar trades around its highest level in five weeks amid renewed U.S.-Iran tensions, which are fueling safe-haven demand, alongside strong U.S. economic data that has increased bets on further rate hikes from the Federal Reserve.
Oil forecast – technical analysis

Oil continues to be guided higher by the 50 SMA, forming a series of higher lows, signalling that bulls are buying the dips. The price recovered from a recent low of 97.20 at the 50 SMA, rising back above 100, and has extended those gains today to test 104.30, close to the 23.6% Fibonacci retracement of the 55–120 move at 105.00. The RSI is also rising, which, combined with the hold above the 50 SMA, keeps buyers hopeful of further upside.
Buyers will look for a move above 105 to bring 111 into focus, the April 30 high. Above here, attention turns to 120, the 2026 peak.
Sellers, however, could be encouraged by the long upper wick on today’s candle. Immediate support can be seen at 100. A break below here exposes the 50 SMA at 97.20, while below that, 95 comes into focus, marking the 38.2% Fibonacci level. Beneath this, sellers will turn their attention to the 50% Fibonacci level at 88.00.
DAX falls as oil prices and inflation worries rise
The DAX, along with its European peers, opened lower on Monday but has recovered from session lows.
The market remains cautious amid concerns over escalating U.S.-Iran tensions following President Trump’s warning over the weekend and fears of potential military action.
With the U.S.-Iran conflict entering its third month, Tehran and Washington remain unable to reach a resolution, while the Strait of Hormuz stays closed. Rising energy prices have fuelled inflation fears and increased expectations of further rate hikes from global central banks. Global bond yields are soaring, keeping pressure on equities.
Given Europe’s dependence on oil imports, European equities have struggled to return to pre-war levels, unlike U.S. equities, which have rebounded on AI-led optimism.
Looking across the week, the main focus will be Thursday’s PMI data after business activity slipped into contraction territory in April and is expected to remain there in May as the stagflationary impact of higher energy prices takes hold.
DAX forecast – technical analysis
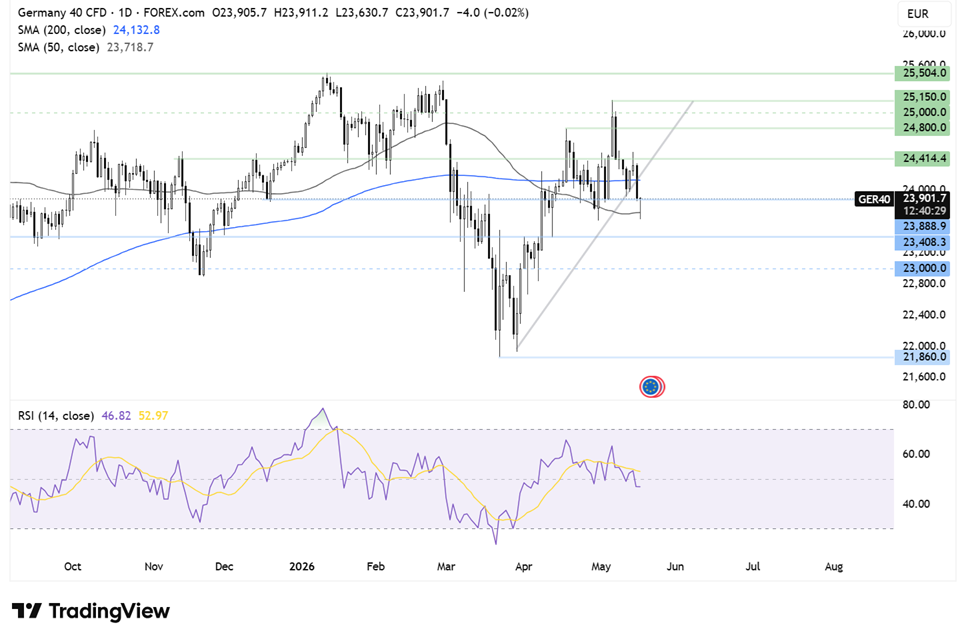
The DAX extended its recovery from the 21,860 low to a peak of 25,150 before turning lower, breaking below rising trendline support and the 200 SMA. While the price briefly fell below the 50 SMA to a low of 23,630, it has since recovered back above this level to trade around 23,900 — a level that has offered both support and resistance in recent months.
Sellers will need a close below the 50 SMA at 23,720 to extend the bearish move towards 23,400. Below here, the April 13 swing low at 23,000 comes into focus.
Buyers, meanwhile, may be encouraged by the price stabilising above the 50 SMA and the long lower wick on today’s candle. A move above 24,130, the 200 SMA, and 24,400 horizontal resistance would put buyers on firmer footing and bring 24,800, the April high, into focus.
Related tags:




The complete CFD trading experience
Award-winning platforms, competitive spreads, low commissions and dedicated support.
We live and breathe the markets and are dedicated to helping traders realise their ambitions as we continue to set the industry bar.
Economic calendar
Web Trader platform
Our sophisticated web-based platform is packed with features.
Related articles

Nasdaq 100 Forecast: NDX slips as Treasury yields keep rising
U.S. stocks are falling at the start of Q4, as gains in software stocks offset concerns over soaring Treasury yields. U.S. Treasury yields continue to rise, with the 10-year yield up 2 basis points at 5.31% and the 30-year at 5.66%, multi-decade highs.

S&P 500 Forecast: SPX rises after cooler-than-expected inflation data
U.S. stocks are rising and Treasury yields are falling after data showed that inflation increased at a cooler pace than expected, while U.S. consumer spending rose again in August.

Treasury Yields Lose Momentum as Energy ETF Retreats
The 10-year Treasury yield is testing a resistance zone respected since the 1920s, as bearish RSI divergence signals fading upside momentum.

StoneX Europe Ltd may make third party material available on this website which may contain information included but not limited to the conditions of financial markets. The material is for information purposes only and does not contain, and should not be construed as containing, investment advice and/or investment recommendation and/or an investment research and/or an offer of or solicitation for any transactions in financial instruments; any decision to enter into a specific transaction shall be made by the client following an assessment by him/her of their situation.
StoneX Europe Ltd makes no representation or warranty and assumes no liability as to the accuracy or completeness of the information provided, nor any loss arising from any investment based on a recommendation, forecast or other information supplied. You should always seek independent advice as to your suitability to speculate in any related markets and your ability to assume the associated risks, if you are at all unsure. We are not under any obligation to update any such material. Any opinion made may be personal to the author and may not reflect the opinion of StoneX Europe Ltd.