



Once again, Canada blows away jobs estimates
With the strong Canadian Employment data, traders may be wondering if the BOC will hike rates again sooner rather than later.
Share this:

Canada released the Employment Change for January, and the results were stellar. The Canadian economy added 150,000 new jobs in January vs an expectation of 15,000 and a December print of 69,200. What adds to the strength of this data is that 121,100 of the jobs were full-time jobs vs 28,900 part-time jobs. We should note that December’s prints were revised lower, however they were still much stronger than the estimates. The Unemployment Rate remained steady at 5% vs 5.1% expected. In addition, Average Hourly Earnings fell to 4.5% YoY vs 4.7% YoY in December.
The Employment Change results should lead one to question the estimates for this data. In October, the actual print of 119,300 blew away estimates, similar to today's print. In December, the expectation was for -10,000 jobs, while the actual print was 84,500. This print was revised lower today to 70,900, however it is still well above the -10,000 estimate. And for January, the print was 150,000 vs an estimate of 15,000. Therefore, estimates going forward need to be taken with a grain of salt as economists seem to be having difficulty estimating the Employment Change.
USD/CAD sold off initially after the data was released as markets think that the strong jobs data means more rate hikes are ahead.

Source: Tradingview, Stone X
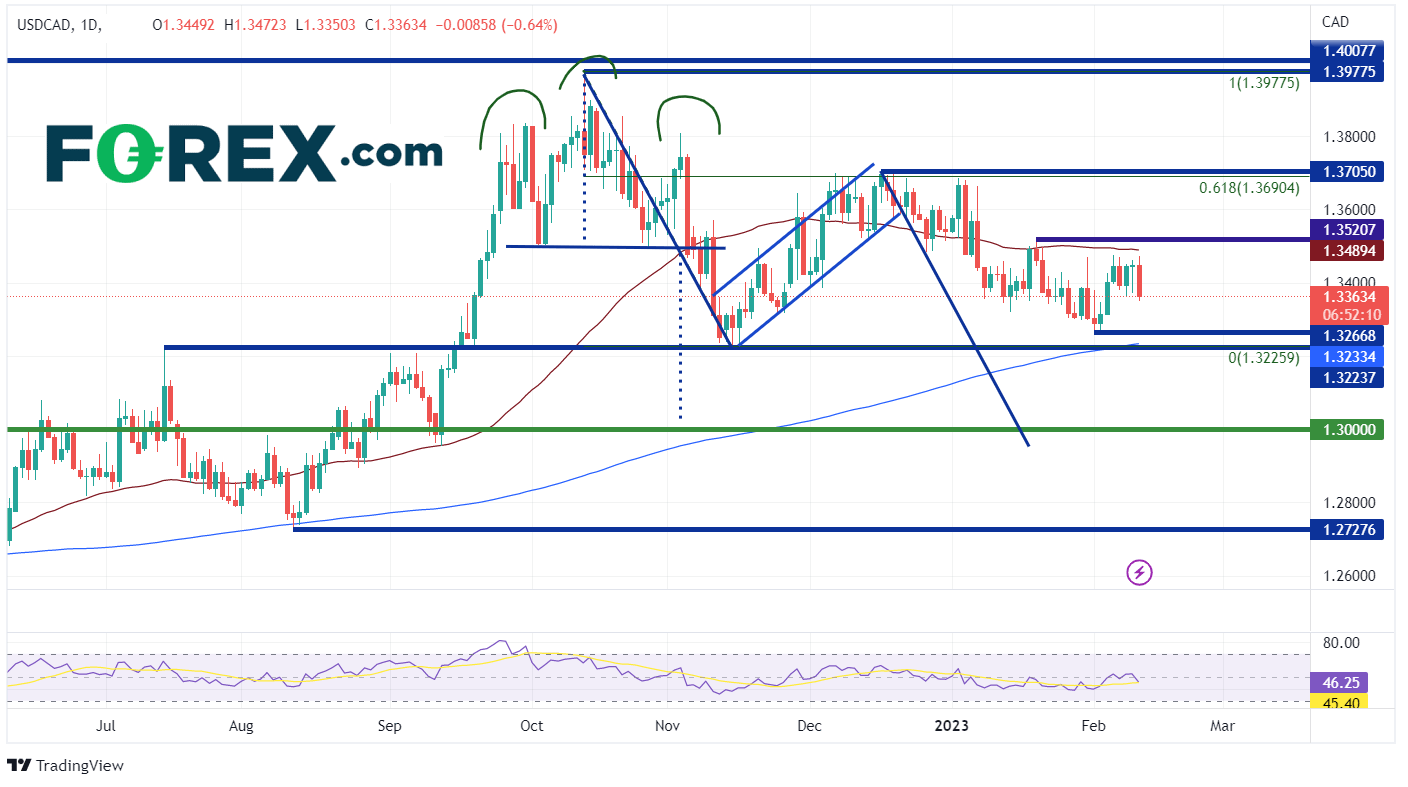
On a daily timeframe, USD/CAD had formed a head and shoulders pattern off the highs of October 13th at 1.3978 and broke the neckline convincingly on November 10th near 1.3496. Price moved lower but failed to reach the target for the head and shoulders pattern near 1.3030, holding support at 1.3226. USD/CAD then retraced 61.8% of October 2022 highs to the November 15th, 2022 lows, forming a flag pattern. The target for the flag pattern is near 1.2960. Price broke out of the flag pattern on December 22nd, 2022 and moved below the 50 Day Moving Average on January 9th. However since then, despite today’s strong payroll data, USD/CAD has been trading in a range between 1.3267 and 1.3521.
Source: Tradingview, Stone X
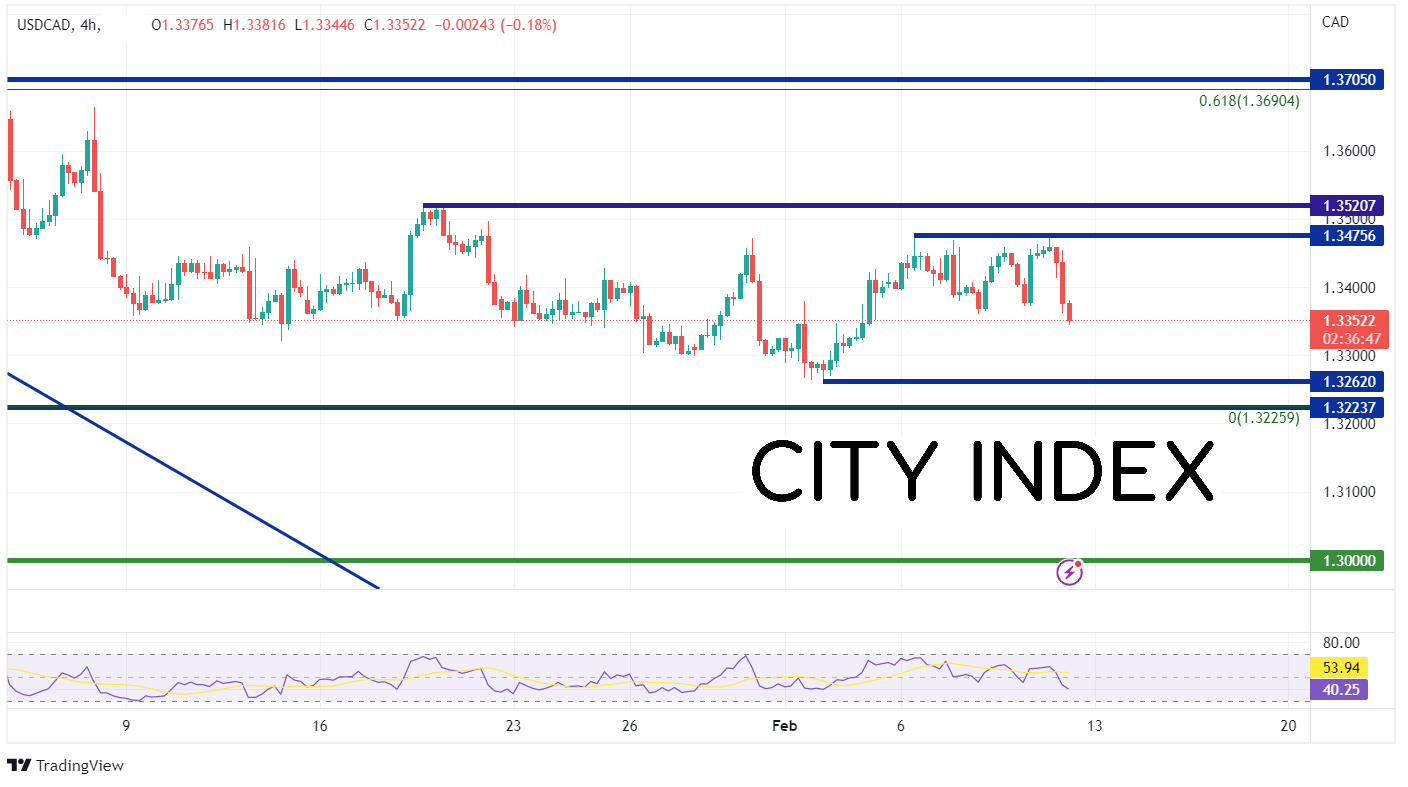
On a 240-minute timeframe, one can better see the range that the USD/CAD has been in since early January. If the pair continues to move lower, first support is at the lows of February 2nd at 1.3262. Below there, price can fall to a confluence of support at the 200 Day Moving Average (see daily) and the lows of November 15th, 2022, between 1.3223 and 1.3233, and then the psychological round number support level of 1.3000. However, if price bounces and remains in the range, the first resistance is at the 50 Day Moving Average at 1.3489 (see daily). Above there, price can move to Friday’s high of 1.3476, then the highs from January 18th at 1.3521.

Source: Tradingview, Stone X
With the strong Canadian Employment data, traders may be wondering if the BOC will hike rates again sooner rather than later. This idea sent USD/CAD lower. However, the pair still hasn’t broken out of its recent range. It may have to wait until Tuesday’s US CPI print to determine the next direction for the pair.
Canada released the Employment Change for January, and the results were stellar. The Canadian economy added 150,000 new jobs in January vs an expectation of 15,000 and a December print of 69,200. What adds to the strength of this data is that 121,100 of the jobs were full-time jobs vs 28,900 part-time jobs. We should note that December’s prints were revised lower, however they were still much stronger than the estimates. The Unemployment Rate remained steady at 5% vs 5.1% expected. In addition, Average Hourly Earnings fell to 4.5% YoY vs 4.7% YoY in December.
The Employment Change results should lead one to question the estimates for this data. In October, the actual print of 119,300 blew away estimates, similar to today's print. In December, the expectation was for -10,000 jobs, while the actual print was 84,500. This print was revised lower today to 70,900, however it is still well above the -10,000 estimate. And for January, the print was 150,000 vs an estimate of 15,000. Therefore, estimates going forward need to be taken with a grain of salt as economists seem to be having difficulty estimating the Employment Change.
USD/CAD sold off initially after the data was released as markets think that the strong jobs data means more rate hikes are ahead.

Source: Tradingview, Stone X
Trade USD/CAD now: Login or Open a new account!
• Open an account in the UK
• Open an account in Australia
• Open an account in Singapore
On a daily timeframe, USD/CAD had formed a head and shoulders pattern off the highs of October 13th at 1.3978 and broke the neckline convincingly on November 10th near 1.3496. Price moved lower but failed to reach the target for the head and shoulders pattern near 1.3030, holding support at 1.3226. USD/CAD then retraced 61.8% of October 2022 highs to the November 15th, 2022 lows, forming a flag pattern. The target for the flag pattern is near 1.2960. Price broke out of the flag pattern on December 22nd, 2022 and moved below the 50 Day Moving Average on January 9th. However since then, despite today’s strong payroll data, USD/CAD has been trading in a range between 1.3267 and 1.3521.

Source: Tradingview, Stone X
On a 240-minute timeframe, one can better see the range that the USD/CAD has been in since early January. If the pair continues to move lower, first support is at the lows of February 2nd at 1.3262. Below there, price can fall to a confluence of support at the 200 Day Moving Average (see daily) and the lows of November 15th, 2022, between 1.3223 and 1.3233, and then the psychological round number support level of 1.3000. However, if price bounces and remains in the range, the first resistance is at the 50 Day Moving Average at 1.3489 (see daily). Above there, price can move to Friday’s high of 1.3476, then the highs from January 18th at 1.3521.
Source: Tradingview, Stone X
With the strong Canadian Employment data, traders may be wondering if the BOC will hike rates again sooner rather than later. This idea sent USD/CAD lower. However, the pair still hasn’t broken out of its recent range. It may have to wait until Tuesday’s US CPI print to determine the next direction for the pair.
Learn more about forex trading opportunities.
Related tags:
Latest market news




The complete CFD trading experience
Award-winning platforms, competitive spreads, low commissions and dedicated support.
We live and breathe the markets and are dedicated to helping traders realise their ambitions as we continue to set the industry bar.
Economic calendar
Web Trader platform
Our sophisticated web-based platform is packed with features.
Related articles
RBA delivers 25bp hike, Bullock now the main event
The RBA delivered the expected 25bp hike, but Bullock’s press conference now looms as the bigger volatility risk for AUD/USD and the ASX 200.
Gold outlook: XAU/USD hammered, stretched and vulnerable to a sharp rebound
Gold is getting hammered for solid fundamental reasons, but history suggests extreme four-hourly oversold conditions can produce violent countertrend rallies.
EUR/USD, USD/JPY Outlook: Oil, yields and an FX identity crisis
Crude oil is setting the tone across rates and FX, leaving EUR/USD vulnerable and USD/JPY caught between higher Treasury yields and the growing threat of intervention
StoneX Europe Ltd may make third party material available on this website which may contain information included but not limited to the conditions of financial markets. The material is for information purposes only and does not contain, and should not be construed as containing, investment advice and/or investment recommendation and/or an investment research and/or an offer of or solicitation for any transactions in financial instruments; any decision to enter into a specific transaction shall be made by the client following an assessment by him/her of their situation.
StoneX Europe Ltd makes no representation or warranty and assumes no liability as to the accuracy or completeness of the information provided, nor any loss arising from any investment based on a recommendation, forecast or other information supplied. You should always seek independent advice as to your suitability to speculate in any related markets and your ability to assume the associated risks, if you are at all unsure. We are not under any obligation to update any such material. Any opinion made may be personal to the author and may not reflect the opinion of StoneX Europe Ltd.