




RBNZ may get Its Cue from RBA Tomorrow
We may get an idea what to expect from the RBNZ, when the RBA meets tomorrow.
Share this:

New Zealand releases its employment data on Wednesday with expectations for the Employment Change for Q3 to rise 0.3% from an increase of 0.8% in Q2. Next week, the RBNZ will meet and will decide whether they should cut key overnight interest rates or leave them on hold at 1.0%. But for the RBNZ, its not quite as simple as looking at their own economy. The RBNZ must also take into consideration China data and the China-US trade war, as China is a key importer from New Zealand. Currently, the market has mixed expectations as to whether they will cut or remain on hold. However, the markets may get a good idea as to what to expect from the RBA tomorrow when they meet and give their outlook on the economy and growth.
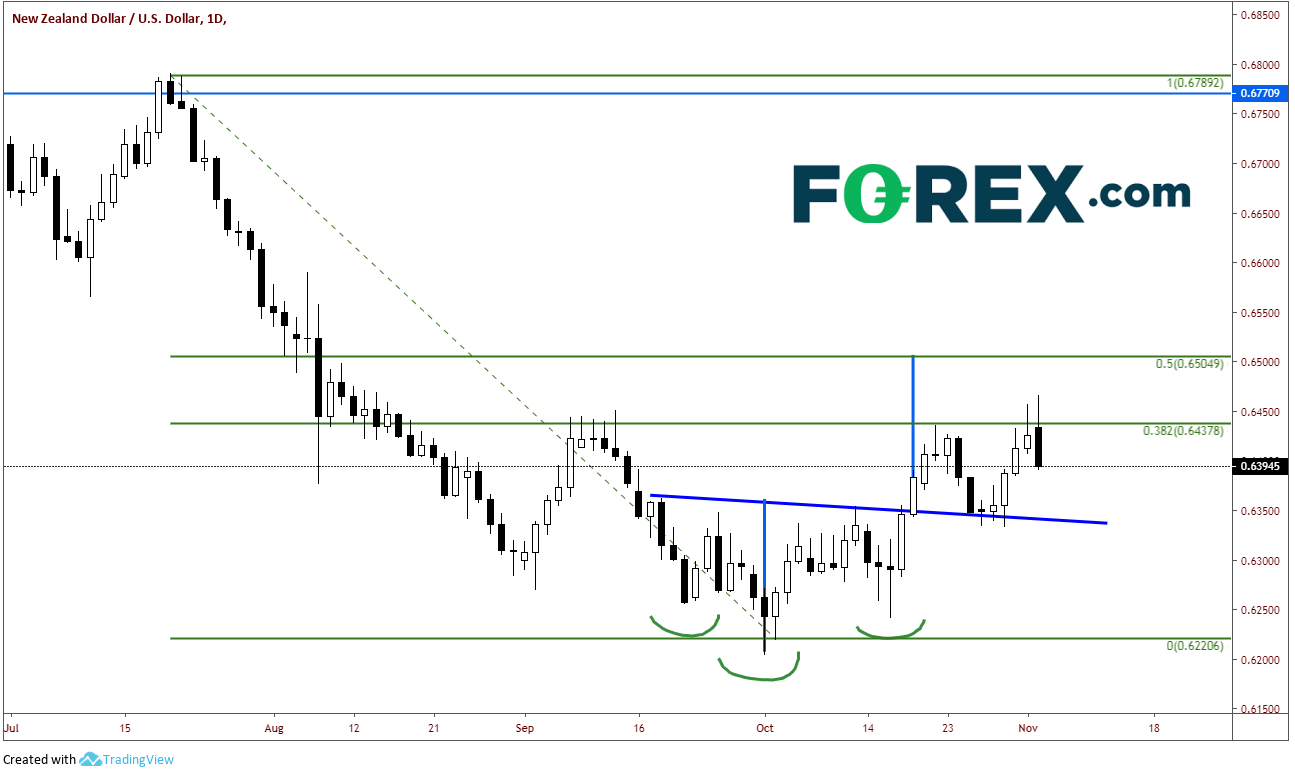
On a daily chart, NZD/USD broke out an inverted head and shoulders pattern on October 18th. The pair halted at the 38.2% Fibonacci retracement level near .6438 from the highs on July 19th to the lows on October 1st. It pulled back to retest the neckline and traded back up to the 38% retracement. On Friday, it appeared the pair was going to head higher to the Inverted head and shoulders target near .6505, however it reversed during the day to put in a shooting star candlestick formation. Today, NZD/USD put in a bearish engulfing pattern, which implies the bears managed to take control and the pair may be headed lower.
Source: Tradingview, City Index
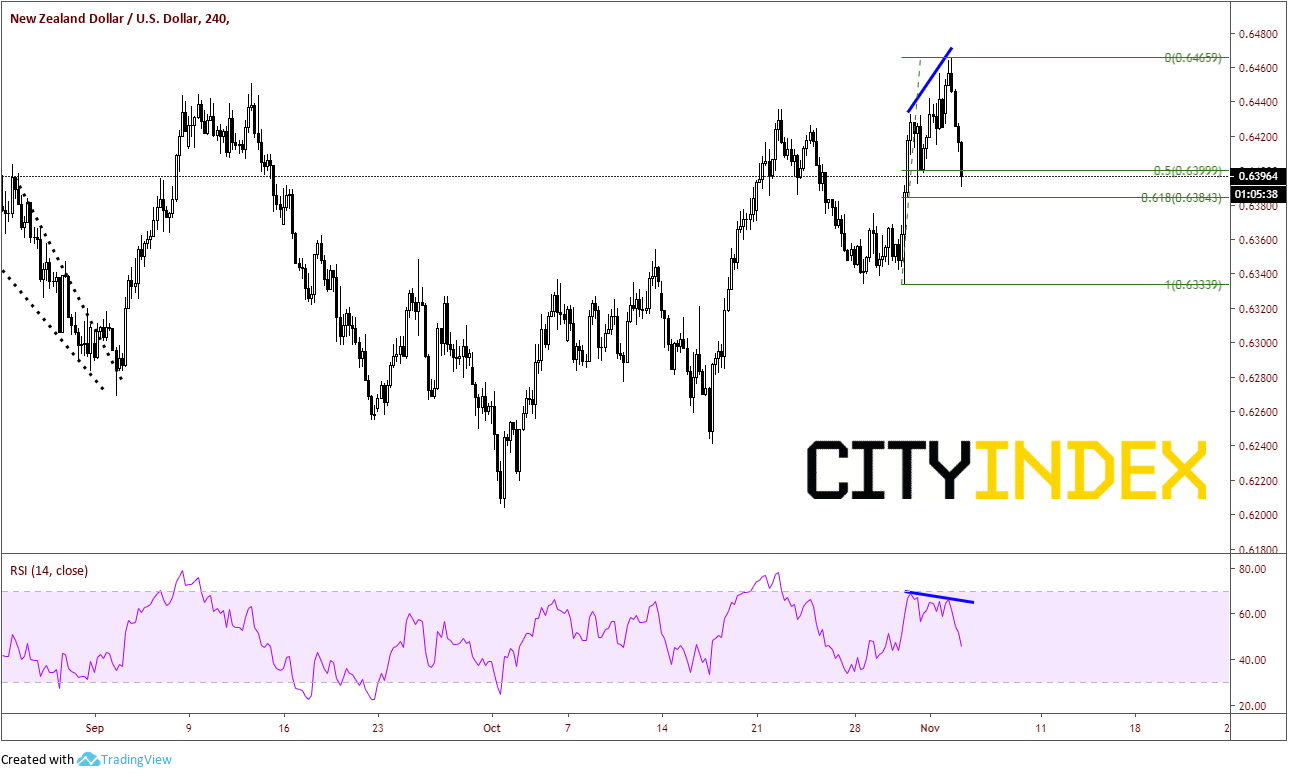
On a 240-minute chart, there is clear divergence between the RSI and price. As price was moving higher, the RSI was moving lower. NZD/USD sold off from the European session open until the US close, as the DXY traded higher. The pair closed the day down almost -0.5%, between the 50% and the 61.8% retracement levels of the October 30th low to todays highs, near .6395.
Source: Tradingview, City Index
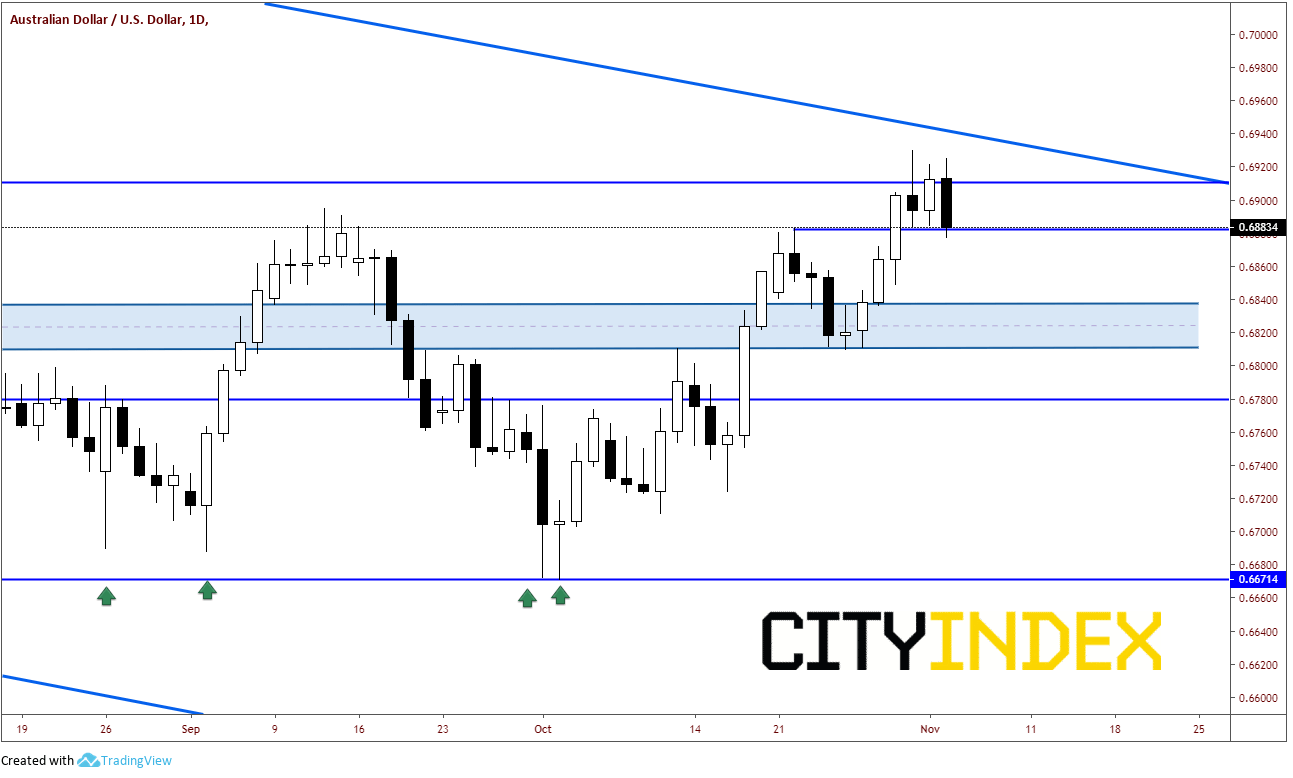
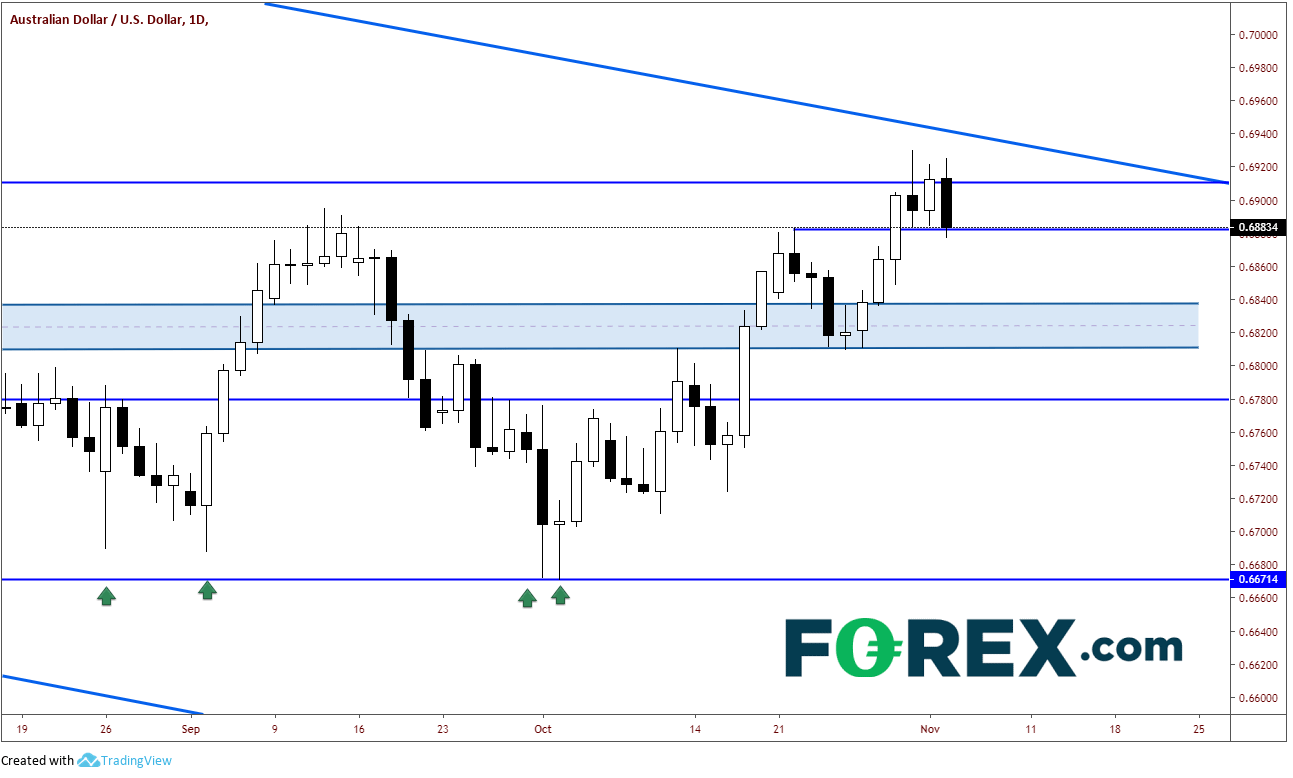
Not surprisingly, AUD/USD also put in a bearish engulfing candlestick formation as the DXY traded higher as well. The pair closed down -.43% near .6882, while the DXY was closed up +.43% near 97.54.
Source: Tradingview, City Index
In a few hours we will know exactly where the RBA stands in terms of their economic outlook. If you are trading the NZD/USD, take cues from both the RBA and the AUD/USD as to what the RBNZ may be considering when they meet next week! (The NZD/USD should begin pricing in expectations).
New Zealand releases its employment data on Wednesday with expectations for the Employment Change for Q3 to rise 0.3% from an increase of 0.8% in Q2. Next week, the RBNZ will meet and will decide whether they should cut key overnight interest rates or leave them on hold at 1.0%. But for the RBNZ, its not quite as simple as looking at their own economy. The RBNZ must also take into consideration China data and the China-US trade war, as China is a key importer from New Zealand. Currently, the market has mixed expectations as to whether they will cut or remain on hold. However, the markets may get a good idea as to what to expect from the RBA tomorrow when they meet and give their outlook on the economy and growth.
On a daily chart, NZD/USD broke out an inverted head and shoulders pattern on October 18th. The pair halted at the 38.2% Fibonacci retracement level near .6438 from the highs on July 19th to the lows on October 1st. It pulled back to retest the neckline and traded back up to the 38% retracement. On Friday, it appeared the pair was going to head higher to the Inverted head and shoulders target near .6505, however it reversed during the day to put in a shooting star candlestick formation. Today, NZD/USD put in a bearish engulfing pattern, which implies the bears managed to take control and the pair may be headed lower.
Source: Tradingview, FOREX.com
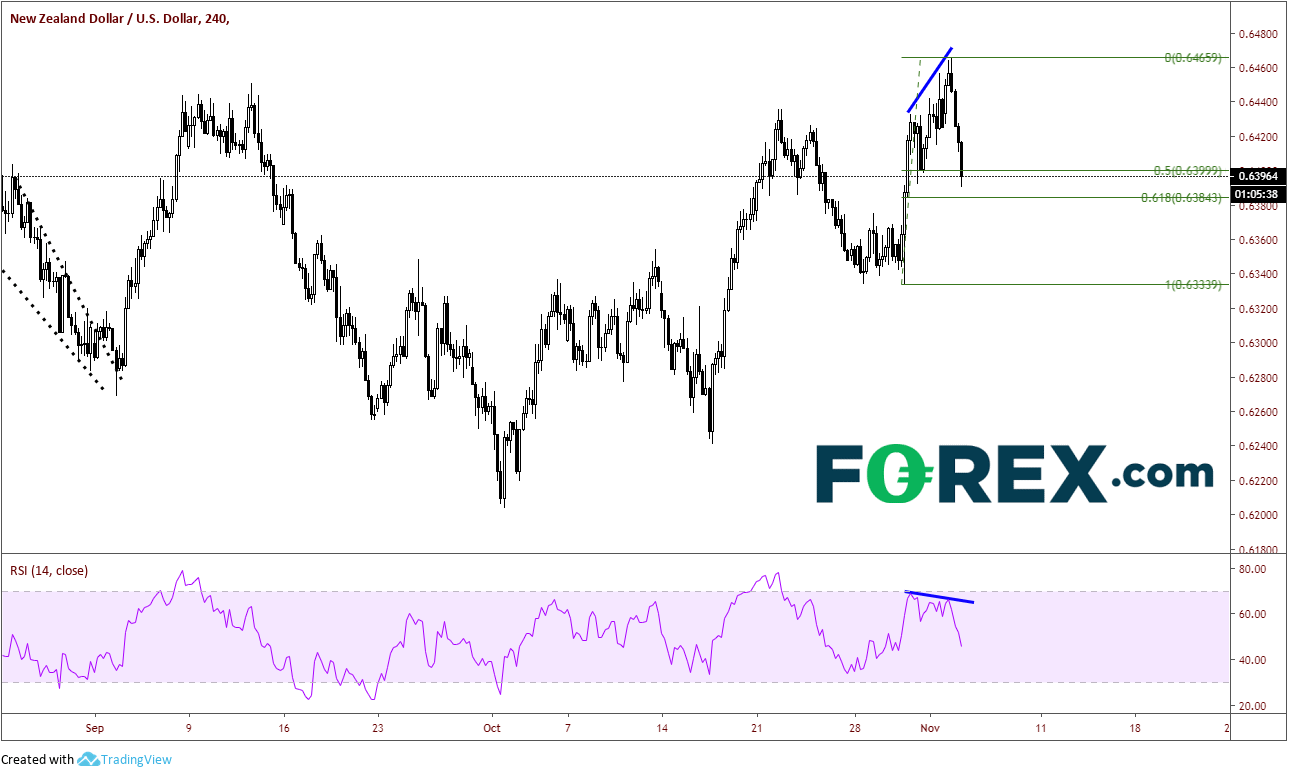
On a 240-minute chart, there is clear divergence between the RSI and price. As price was moving higher, the RSI was moving lower. NZD/USD sold off from the European session open until the US close, as the DXY traded higher. The pair closed the day down almost -0.5%, between the 50% and the 61.8% retracement levels of the October 30th low to todays highs, near .6395.
Source: Tradingview, FOREX.com
Not surprisingly, AUD/USD also put in a bearish engulfing candlestick formation as the DXY traded higher as well. The pair closed down -.43% near .6882, while the DXY was closed up +.43% near 97.54.
Source: Tradingview, FOREX.com
In a few hours we will know exactly where the RBA stands in terms of their economic outlook. If you are trading the NZD/USD, take cues from both the RBA and the AUD/USD as to what the RBNZ may be considering when they meet next week! (The NZD/USD should begin pricing in expectations).


The complete CFD trading experience
Award-winning platforms, competitive spreads, low commissions and dedicated support.
We live and breathe the markets and are dedicated to helping traders realise their ambitions as we continue to set the industry bar.
Economic calendar
Web Trader platform
Our sophisticated web-based platform is packed with features.
Related articles

Euro Short-term Outlook: EUR/USD Selloff Nears Critical Yearly Support 9 23 2026
Euro has fallen seven of the past nine sessions, with stretched momentum raising the stakes as EUR/USD closes in on a major inflection zone.


GBP/USD forecast: US dollar surges as bonds implode
The US dollar continued to press higher deep into the European session, supported by the slump in the bond markets as yields broke out across the curve. Following the recent hawkish Fed rate hike, yield spreads between the US and the rest of the world has continually increased, and that motion continued today, helped in part by some forecast-beating US macro data and hawkish Fed commentary.


Australian Dollar Technical Outlook: AUD/USD Breakdown Threatens Deeper Correction 9 23 2026
AUD/USD remains under pressure after breaking key trend support, with the latest decline putting the focus on the next major downside pivot.
StoneX Europe Ltd may make third party material available on this website which may contain information included but not limited to the conditions of financial markets. The material is for information purposes only and does not contain, and should not be construed as containing, investment advice and/or investment recommendation and/or an investment research and/or an offer of or solicitation for any transactions in financial instruments; any decision to enter into a specific transaction shall be made by the client following an assessment by him/her of their situation.
StoneX Europe Ltd makes no representation or warranty and assumes no liability as to the accuracy or completeness of the information provided, nor any loss arising from any investment based on a recommendation, forecast or other information supplied. You should always seek independent advice as to your suitability to speculate in any related markets and your ability to assume the associated risks, if you are at all unsure. We are not under any obligation to update any such material. Any opinion made may be personal to the author and may not reflect the opinion of StoneX Europe Ltd.