



S&P 500 weekly outlook: surging oil raises stagflation fears
Our S&P 500 outlook remains cautious with a bearish tilt. Unless there’s a sharp improvement in the Middle East situation, markets could head further lower in the week ahead and may even gap lower on Monday.
Share this:

A disappointing jobs report was among a growing list of factors that knocked the wind out of equities on Friday, with financials taking the brunt of the sell-off. The drop arrived at a time when rising tensions in the Middle East have sent oil prices soaring and stoking fresh inflation concerns. On top of this, renewed unease around the private credit sector further dampened risk appetite. There was not much for the bulls to get excited over. Unsurprisingly, investors sold stocks and the S&P 500 slid 1.3% on the day, leaving the benchmark nursing its worst weekly performance since October. Unless there’s a sharp improvement in the Middle East situation, markets could head further lower in the week ahead and may even gap lower on Monday. Our S&P 500 outlook remains cautious with a bearish tilt.
Week ahead: it is all about oil prices
With not much on the calendar in the week ahead, it will all be about oil prices, which continued to surge on Friday. US crude pushed above $90 a barrel, marking its largest weekly gain on record as traders priced in the risk of deeper disruption across global energy supplies.
With no obvious signs of de-escalation in the Middle East, the conflict is increasingly spilling into energy markets and fuelling concerns about renewed price pressures. This is the key theme to watch in the week ahead, and you can almost forget about everything else. The longer the conflict continues, the worse the situation will get for oil prices and the global economy.
Stagflation risks put the Fed in a tricky spot
A negative payrolls print arriving alongside a sharp jump in oil prices is the kind of combination that inevitably revives talk of stagflation. That’s a mix of slowing growth and persistent inflation. If the labour market were to weaken meaningfully, it would normally strengthen the case for rate cuts. But the risk that sustained higher oil prices could reignite inflation leaves the Fed in a difficult position. Policymakers may ultimately decide that the safest option, at least for now, is to stay on the sidelines and wait for greater clarity.
With Trump calling for "unconditional surrender" by Iran, the odds of a quick resolution has fallen further. This could lead to continued fighting and bombardment, and retaliation. Ultimately we could see even higher oil prices and a further drop in equity markets in scenario.
Non-farm payrolls adds fuel to recession worries
The US jobs report for the month of February was a massive disappointment. The economy lost 92,000 jobs during the month, with the unemployment rate rising to 4.4%. That was well below expectations, which had been for a gain of around 55,000 jobs.
More worryingly, the private sector shed 86,000 jobs during the month, highlighting underlying weakness in the labour market.
On top of that, there was a 69,000 downward revision to the previous couple of months’ data, which ultimately led to negative job growth for December. That revision is arguably the most concerning part of the report, as it suggests the labour market had already been weaker than initially thought.
S&P 500 weekly outlook: technical analysis and levels to watch
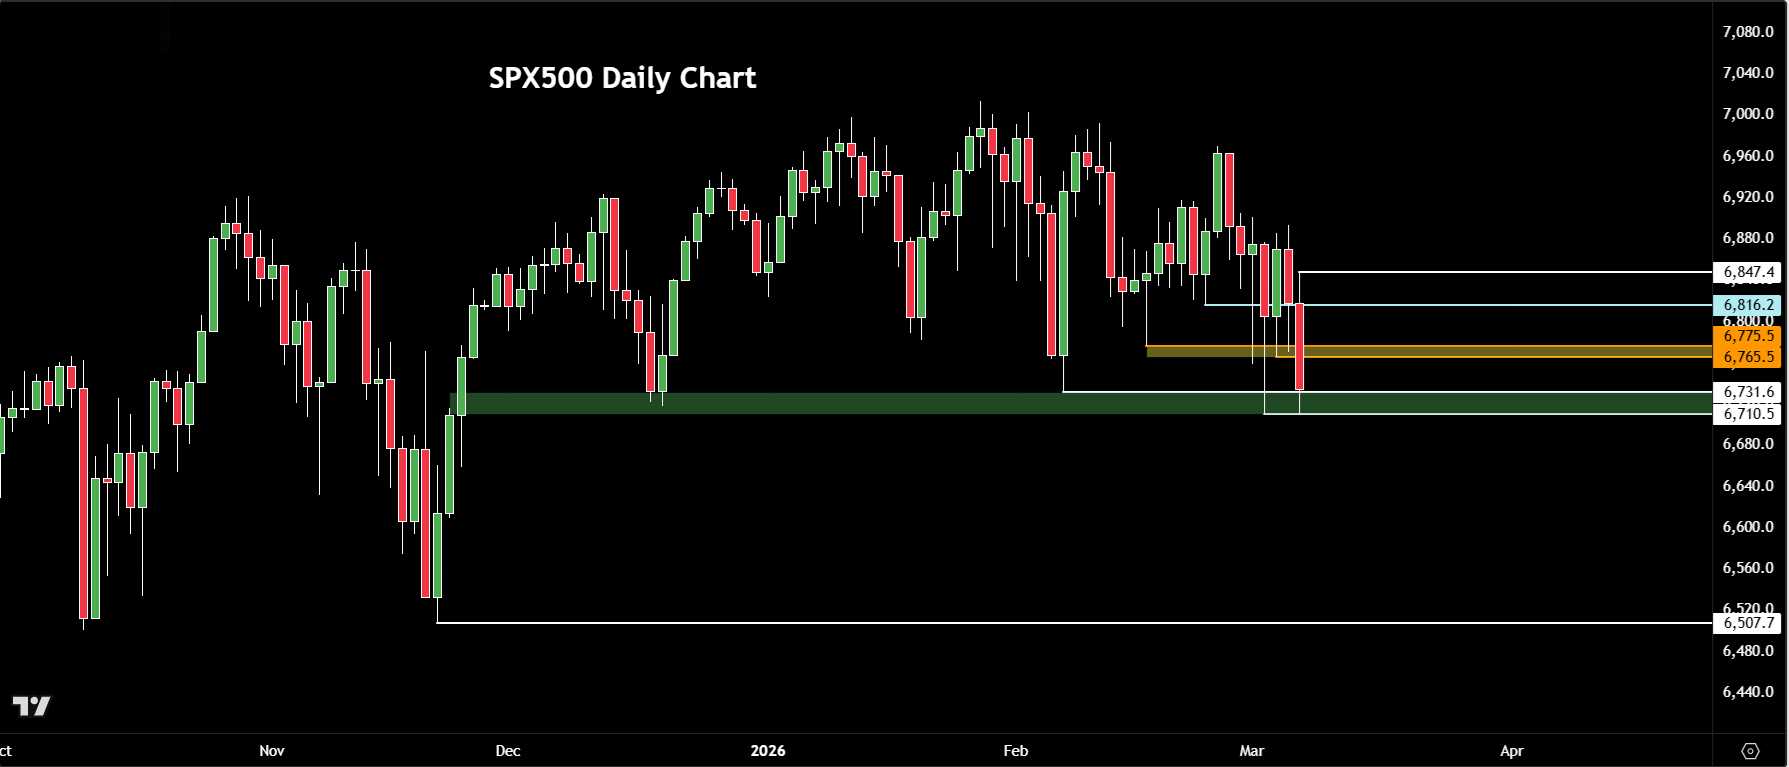
Our US SP 500 chart, which tracks the underlying S&P 500 futures, broke below a key support zone between 6765 and 6775 on Friday and held below it on a closing basis. If the index holds below this level in early parts of next week, then the sellers could gain the upper hand and drive the market sharply lower.
Initial support is seen around Friday’s and recent lows of 6731 to 6710 area. Below here, there are no obvious nearby support levels until the November low at 6507. That could become the next downside target if bearish momentum continues to build.
In terms of resistance, the key short term area to watch now is that broken support between 6765 and 6775 area. Above that, 6815/16 is the next potential resistance followed by Friday’s high at 6847. If the market manages to break above that level, it would signal underlying strength and suggest that, despite everything happening in the background, the market is not ready to fall. That would be a very strong signal for equities.
What else to watch in the week ahead?
Judging by Friday’s price action, and recent events, the outlook isn’t particularly encouraging right now. A lot will now depend on the situation in the Middle East.
From a macro point of views, it is not a super busy week next week, with much of the focus likely to remain on geopolitics in the Middle East. Still, a couple of important data highlights are scheduled which could cause some short-term noise at least.
- US CPI Inflation Report
Date: Wednesday, March 11
Time: 12:30 PM GMT
The US Consumer Price Index is expected to show inflation running at 2.5% year-over-year, up from 2.4% the month before. With crude oil prices soaring in recent weeks, there is a possibility that inflation pressures could increase again in the coming months. If the data shows that price pressures had already remained high in February, markets may begin to price in a longer period of higher interest rates, which could provide additional support for the US dollar and undermine equities.
- US Data Dump
Date: Friday, March 13
Time: 12:30 PM GMT (main releases)
Friday will bring a series of important US economic releases, including the preliminary GDP estimate, Durable Goods Orders, and the Core PCE Price Index, which is the Federal Reserve’s preferred measure of inflation. Later in the day, markets will also receive JOLTS job openings data and the University of Michigan consumer sentiment survey, including inflation expectations. Investors will evaluate these reports collectively to assess the overall strength of the US economy and what it could mean for the outlook for interest rates and the markets.
Daylight saving time shift in North America on Sunday
Finally, it is worth pointing out that London will be 4 hours behind NY for the next three weeks as US and Canada switch to daylight savings on Sunday, with Europe to follow on 29th March. This means that regular US data releases will come out one hour sooner for European investors, and that also applies to the regular market opening and closing times.


-- Written by Fawad Razaqzada, Market Analyst
Follow Fawad on Twitter @Trader_F_R
How to trade with City Index
You can trade with City Index by following these four easy steps:
- Open an account, or log in if you’re already a customer
• Open an account in the UK
• Open an account in Australia
• Open an account in Singapore
- Search for the company you want to trade in our award-winning platform
- Choose your position and size, and your stop and limit levels
- Place the trade


The complete CFD trading experience
Award-winning platforms, competitive spreads, low commissions and dedicated support.
We live and breathe the markets and are dedicated to helping traders realise their ambitions as we continue to set the industry bar.
Economic calendar
Web Trader platform
Our sophisticated web-based platform is packed with features.
Related articles
Euro Short-term Outlook: EUR/USD Selloff Nears Critical Yearly Support 9 23 2026
Euro has fallen seven of the past nine sessions, with stretched momentum raising the stakes as EUR/USD closes in on a major inflection zone.

GBP/USD forecast: US dollar surges as bonds implode
The US dollar continued to press higher deep into the European session, supported by the slump in the bond markets as yields broke out across the curve. Following the recent hawkish Fed rate hike, yield spreads between the US and the rest of the world has continually increased, and that motion continued today, helped in part by some forecast-beating US macro data and hawkish Fed commentary.

Australian Dollar Technical Outlook: AUD/USD Breakdown Threatens Deeper Correction 9 23 2026
AUD/USD remains under pressure after breaking key trend support, with the latest decline putting the focus on the next major downside pivot.
StoneX Europe Ltd may make third party material available on this website which may contain information included but not limited to the conditions of financial markets. The material is for information purposes only and does not contain, and should not be construed as containing, investment advice and/or investment recommendation and/or an investment research and/or an offer of or solicitation for any transactions in financial instruments; any decision to enter into a specific transaction shall be made by the client following an assessment by him/her of their situation.
StoneX Europe Ltd makes no representation or warranty and assumes no liability as to the accuracy or completeness of the information provided, nor any loss arising from any investment based on a recommendation, forecast or other information supplied. You should always seek independent advice as to your suitability to speculate in any related markets and your ability to assume the associated risks, if you are at all unsure. We are not under any obligation to update any such material. Any opinion made may be personal to the author and may not reflect the opinion of StoneX Europe Ltd.