



S&P 500 Bull Flag Breakout as Long-Term Yields Ease
The fear on the long end of the Treasury curve has taken a step back even as two-year notes saw a massive jump in yield last week. But looking at stocks rallies appear set for resumption with the bull flag in the S&P 500 giving way to an early-week breakout.
Share this:

S&P 500 Talking Points:
- Despite a sell-off at the FOMC meeting last week bulls have shown a strong response in the days after, leading to this week’s bullish breakout from a bull flag formation.
- The question for this week is whether we see strength in tech and AI-stocks, as that lagging quality behind the prior leader brought upon fears of a shift in the equity space.
- The calming in crude oil markets has likely played a role, along with an easing in longer-term yields, both themes explored in this week’s Top 5 Charts for the Week video, linked below.
This content was created by an affiliate of FOREX.com and represents the views and opinions of the author/speakers, not the views and opinions of Forex.com, StoneX Group Inc., or its subsidiaries. The content has not been independently reviewed by FOREX.com.
The beauty of technical analysis is that it tends to condense known facts at a time into a palatable format. To be sure, this doesn’t mean that it’s predictive, as new ‘stuff’ happens all the time and that can, in-turn, effect prices and trends and themes.
But in reality – nothing is predictive – and once a trader learns that they can then move on to looking for methods that can help in search of any possible bias that may be possible.
Bull flag formations, for instance, put into context a bearish short-term backdrop. Like we saw in equities over the past couple of months, ever since Kevin Warsh took over the Fed with a hawkish drive. While the pre-existing thought was that President Trump’s hand picked successor at the Fed would simply input his rate cut directive, Warsh has struck a far different tone and last week he resided over the first rate hike in three years. Not only that – he also warned that another was probably on the way.
From the context of the situation it seems like he has no choice. Oil prices continue to flirt with $100/barrel on the back of the ongoing campaign against Iran and US Treasury yields are at or near 19-year highs and given the build of US debt, that feels rather unsustainable for the long-term.
But – that’s just the headline fodder, and at this point, stocks have remained strong because much like we’ve seen time and time again since the Financial Collapse, policymakers are prioritizing market health and dynamics as a matter of importance. This explains why we’ve been seeing larger and larger buy backs from the US Treasury even as they have an upcoming maturity wall with a massive amount of principal coming due. This also probably has something to do with calming in long-term yields last week, even as two-year yields jumped dramatically.
This seems to be the expectation that Bessent will do something similar to Yellen the last time the 10-year traded at 5%, and that’s to shift upcoming debt to the shorter-end of the curve.
Given the importance of long-term rates and how 10 and 30-year yields are more correlated with things like mortgages, this could provide some hope for markets that strength can continue to show in the US.
And collectively, between easing oil prices and long-term yields, that’s probably a big reason for the strong risk-on move to start this week, key of which is a clean breakout from the bull flag formation in the S&P 500.
S&P 500 Daily Chart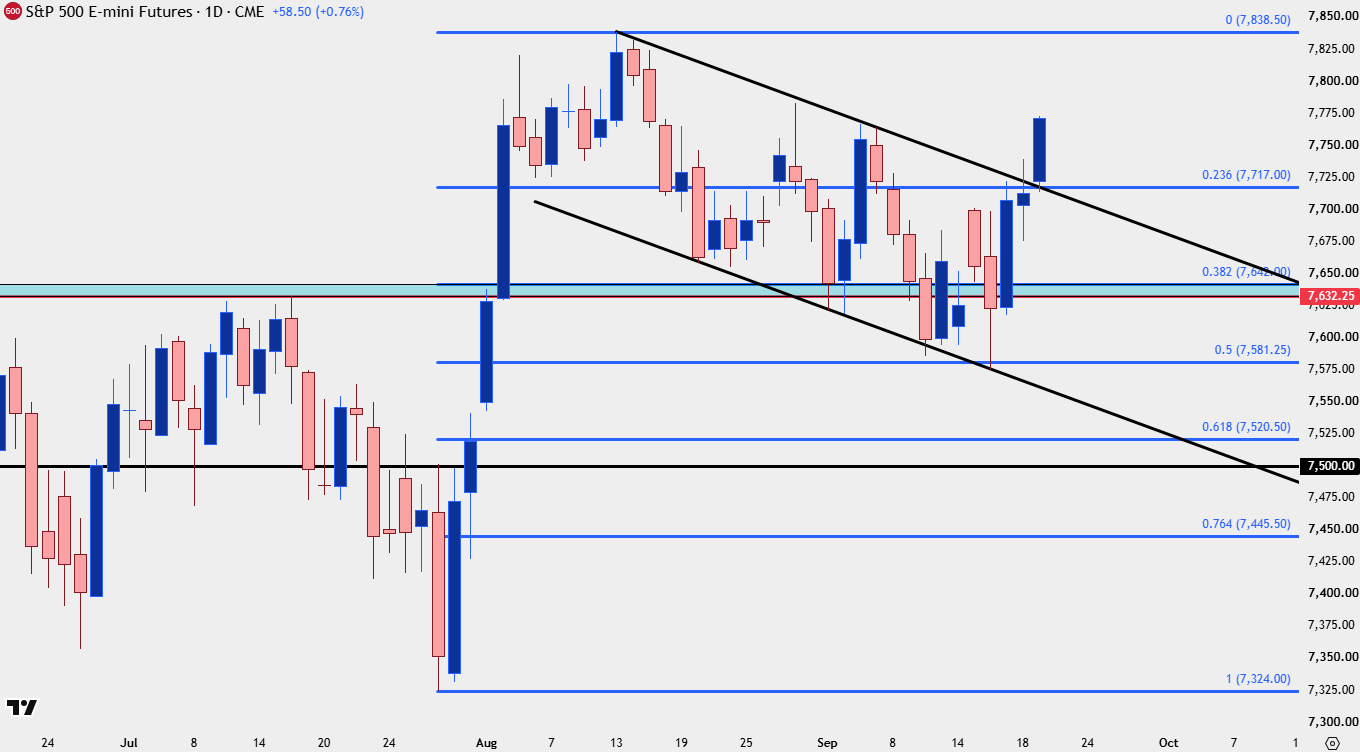
Chart prepared by James Stanley; data derived from Tradingview
--- written by James Stanley, Senior Market Analyst, Global Macro
Related tags:
Latest market news




The complete CFD trading experience
Award-winning platforms, competitive spreads, low commissions and dedicated support.
We live and breathe the markets and are dedicated to helping traders realise their ambitions as we continue to set the industry bar.
Economic calendar
Web Trader platform
Our sophisticated web-based platform is packed with features.
Related articles

USD into a Massive Week as Yields Fly and Gold Breaks
It’s a huge week with PCE and NFP, but it’s what’s happening off of the calendar that demands attention with US yields flying to fresh multi-decade highs.

Nasdaq 100 Forecast: NDX falls as oil jumps and Treasury yields rise
U.S. stocks are pointing to a weaker open on Monday after President Trump rejected an Iranian ceasefire, sending oil prices higher and fuelling inflationary concerns and pushing Treasury yields higher.


S&P 500, Nasdaq, Dow Forecast: Wall Street Split Widens Into Month-End 9 26 2026
Nasdaq strength contrasts with mounting Dow pressure as rising Treasury yields raise the stakes for stocks heading into the monthly close.

StoneX Europe Ltd may make third party material available on this website which may contain information included but not limited to the conditions of financial markets. The material is for information purposes only and does not contain, and should not be construed as containing, investment advice and/or investment recommendation and/or an investment research and/or an offer of or solicitation for any transactions in financial instruments; any decision to enter into a specific transaction shall be made by the client following an assessment by him/her of their situation.
StoneX Europe Ltd makes no representation or warranty and assumes no liability as to the accuracy or completeness of the information provided, nor any loss arising from any investment based on a recommendation, forecast or other information supplied. You should always seek independent advice as to your suitability to speculate in any related markets and your ability to assume the associated risks, if you are at all unsure. We are not under any obligation to update any such material. Any opinion made may be personal to the author and may not reflect the opinion of StoneX Europe Ltd.