



Silver Price Outlook: Lagging or Leading Gold?
Silver’s recent 8% rally toward $86 is raising questions about gold’s relatively weaker trend near the 4,700 level. Is silver leading the move, or simply lagging gold’s broader trajectory?
Share this:

Markets are reacting to the rise in US inflation data, with CPI at 3.8%, last seen in 2023, reinforcing a higher-for-longer rate environment.
Key Macro Drivers Impacting Gold & Silver
- Silver’s recent 8% rally toward $86 is challenging gold’s relatively softer price action near 4,700
- Markets are focused on the recent US CPI and its interpretation, with inflation risks skewed higher for longer
- The Bank of Japan’s Summary of Opinions highlighted the near-term possibility of a rate hike, pushing Japanese bond yields toward 2.5%, the highest since 1999, and adding pressure on global bond markets
- US 2-year and 10-year Treasury yields are hovering near yearly highs, weighing on gold below the 4,800 level
- Crude oil prices stabilizing near $100 suggest a prolonged energy recovery, reinforcing inflation and yield expectations—factors that continue to pressure precious metals
From this perspective, silver’s rally may reflect a late-cycle catch-up move, potentially marking a final push higher before aligning with gold if macro pressures intensify. As markets absorb the broader impact of energy-driven inflation, both metals could face downside risks.
Recent insights on gold can be found in the latest StoneX video below.
This content was created by an affiliate of FOREX.com and represents the views and opinions of the author/speakers, not those of FOREX.com, StoneX Group Inc., or its subsidiaries. The content has not been independently reviewed by FOREX.com.
Silver Price Action: Daily Time Frame (Log Scale)
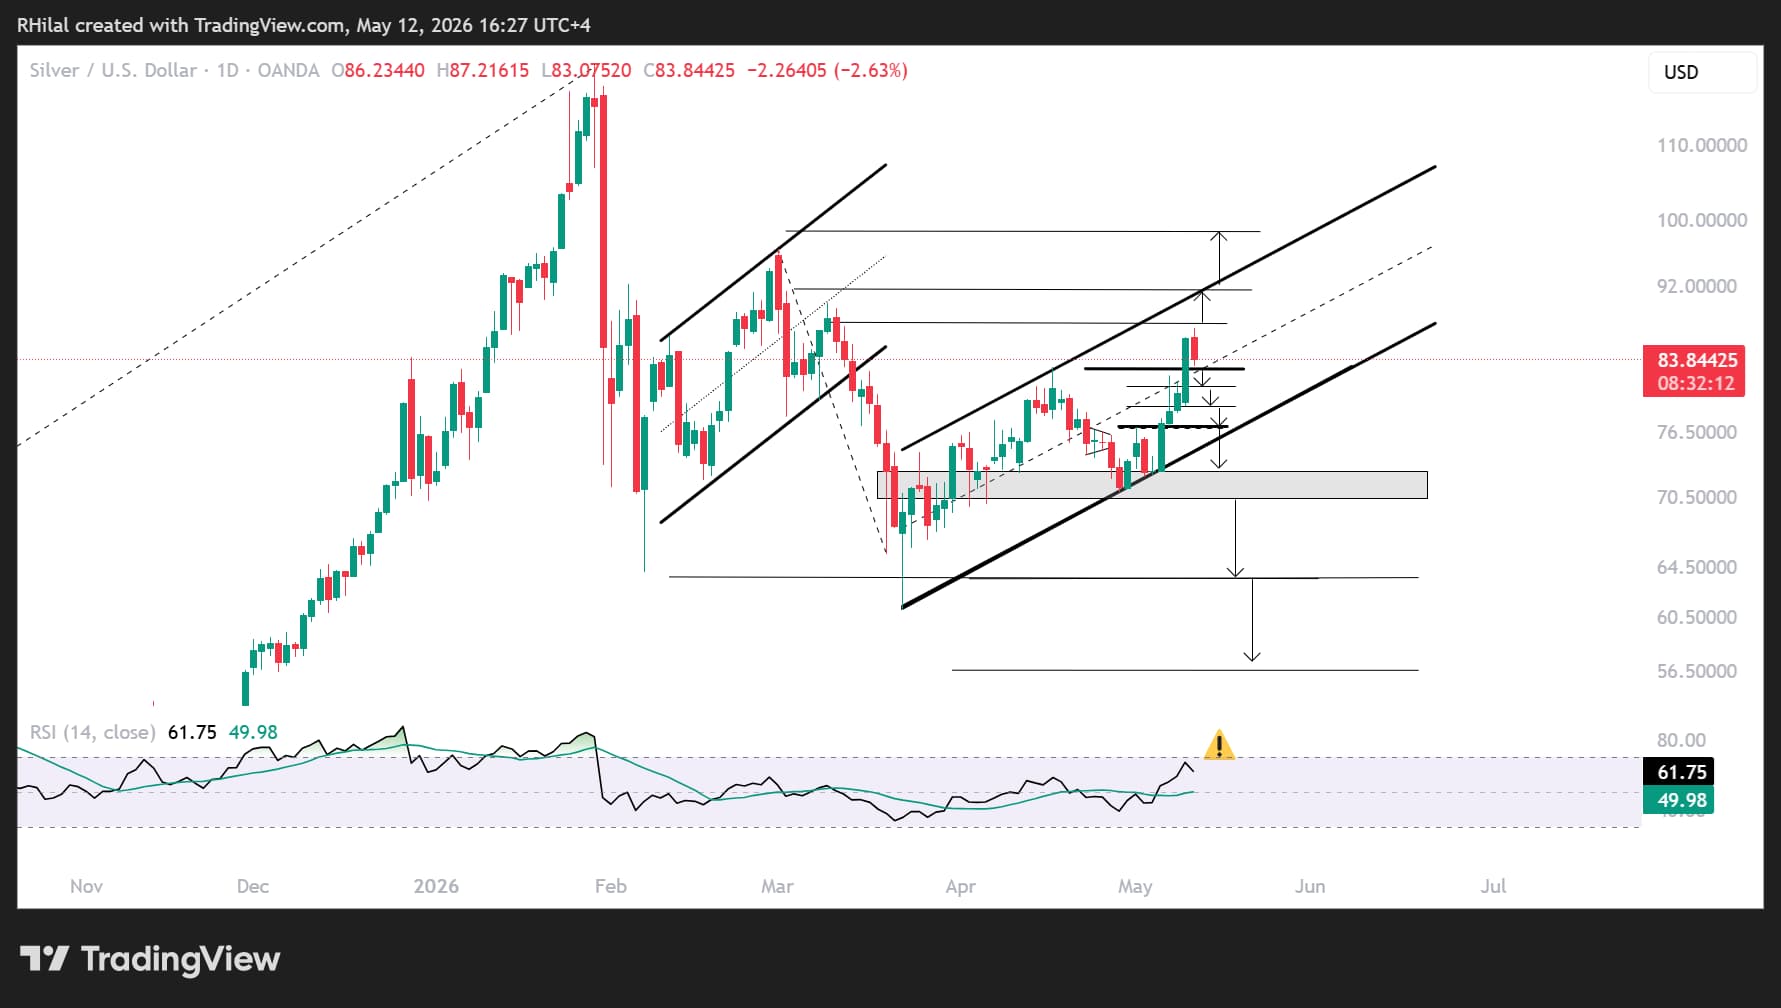
Source: Trading view
Silver’s bullish rebound from yearly lows near 61 remains intact within a strong uptrend, currently facing resistance near 87. Recent inflation dynamics have triggered a pullback toward the 83 level, now acting as a key pivot.
Key Scenarios to Watch
Bearish Scenario:
- A breakdown below 83 would increase downside pressure toward 81, 79, and 77, aligning with the lower bound of the prevailing uptrend
- A deeper correction could extend the broader downtrend from February 2026 highs, targeting 70, 63, and potentially 48, presenting longer-term buying opportunities
Bullish Scenario:
- A breakout above 87 would extend gains toward the upper channel resistance near 91.50
- A sustained move higher could trigger a stronger bullish breakout toward the 98–100 zone, although this may also increase the risk of a sharp pullback
Written by Razan Hilal, CMT
Follow on X: @Rh_waves
Related tags:
Latest market news



The complete CFD trading experience
Award-winning platforms, competitive spreads, low commissions and dedicated support.
We live and breathe the markets and are dedicated to helping traders realise their ambitions as we continue to set the industry bar.
Economic calendar
Web Trader platform
Our sophisticated web-based platform is packed with features.
Related articles
Gold Q4 2026 outlook: Resilience in the face of rallying dollar and yields
As we headed towards the latter stages of Q3 and into Q4, the Fed had just hiked rates in a hawkish FOMC meeting, while the likes of the ECB and BoJ had also tightened their respective policies. Oil prices remained elevated amid the prolonged US-Iran conflict. Meanwhile, bond yields were breaking out, and the dollar was higher across the board. Yet, remarkably, gold was still holding in the positive territory for the third quarter, even if it had weakened somewhat in September.

EUR/USD Q4 2026 Outlook: Euro at a Crossroads as Fed, ECB Tighten 9 25 2026
EUR/USD enters Q4 at a pivotal inflection point as competing Fed-ECB policy paths and persistent inflation risks collide with major technical support.


USD/JPY Q4 2026 Outlook: Hawkish Fed Pricing Clashes With Intervention Risk
The year-end tug-of-war is clear: hawkish Fed pricing supports USD/JPY, while intervention risk limits the upside.

StoneX Europe Ltd may make third party material available on this website which may contain information included but not limited to the conditions of financial markets. The material is for information purposes only and does not contain, and should not be construed as containing, investment advice and/or investment recommendation and/or an investment research and/or an offer of or solicitation for any transactions in financial instruments; any decision to enter into a specific transaction shall be made by the client following an assessment by him/her of their situation.
StoneX Europe Ltd makes no representation or warranty and assumes no liability as to the accuracy or completeness of the information provided, nor any loss arising from any investment based on a recommendation, forecast or other information supplied. You should always seek independent advice as to your suitability to speculate in any related markets and your ability to assume the associated risks, if you are at all unsure. We are not under any obligation to update any such material. Any opinion made may be personal to the author and may not reflect the opinion of StoneX Europe Ltd.