







Squeeeeeeze
The Australian Dollar pairs may be ready for a good, old-fashioned squeeze!
Share this:
Generally, when stocks up, the Australian Dollar goes up with them. Often we refer to the correlation coefficient and how it can be used to help determine the possible direction of one asset based on its correlation with another asset. In this case, the S&P 500 and the AUD/USD have a +.95 correlation coefficient. A correlation of +1.00 means that the 2 assets move perfectly together 100% of the time. Therefore, a correlation coefficient of +.95 is pretty close.
Source: Tradingview, CME, City Index
Notice on the chart above how the S&P 500 is trying to break above the recent highs of 2885 from April 17th. That level is just below the phycological resistance of 2900 and the 61.8% retracement from the February 20th highs to the March 23rd lows at 2933. Think about how many people may have gotten short near these levels. That may actually be the reason stocks pulled back on April 20th and 21st. Now, think about where those traders may have put their stops. Buyers that were in the market on a quiet day may ultimately be trying to push stocks higher to eventually take out those stops! This is known as a squeeze - the market is squeezing the shorts out of the market! (And what a perfect week to try and do it with companies such as AMNZ and MSFT reporting this week)
If someone is looking to trade the S&P 500, either as a long looking for new highs or a short with stops above 2933, but would rather do it via a currency pair, a pair to consider is the AUD/USD. The pair already has a squeeze of its own taking place, which given the correlation coefficient, should help drag stocks higher with it. The AUD/USD has broken through horizontal resistance, prior highs and is currently trading just above the 61.8% Fibonacci retracement level from the December 31st, 2019 highs to the March 18th lows near .6455. The next resistance level about isn’t until .6660.
Source: Tradingview, City Index
Many other Australian Dollar currency pairs are breaking through key levels and could squeeze further. Below are a few examples:
AUD/JPY
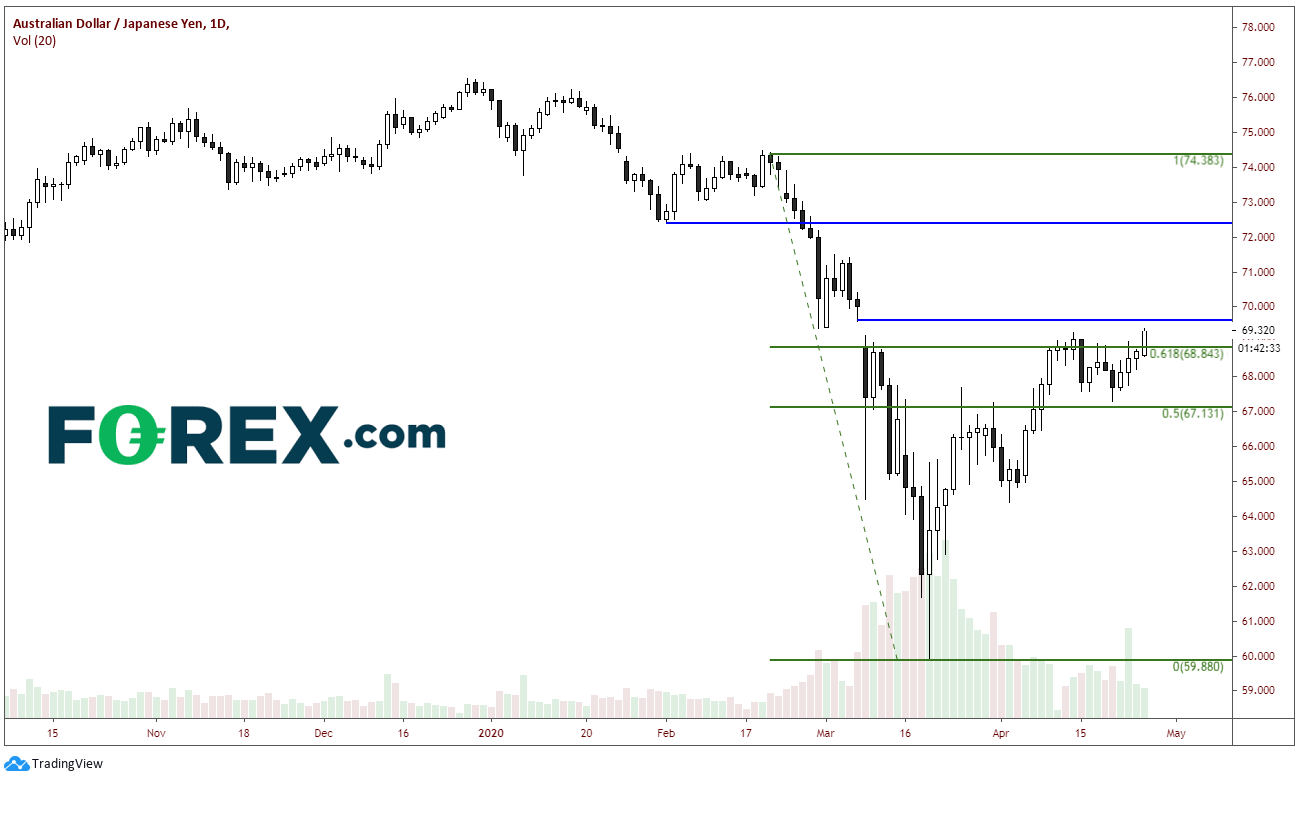
AUD/JPY is trading just above the 61.8% Fibonacci retracement from the highs of February 20th to the lows of March 19th and trying to fill the gap resistance from March 6th near 69.60.
Source: Tradingview, City Index
AUD/CAD
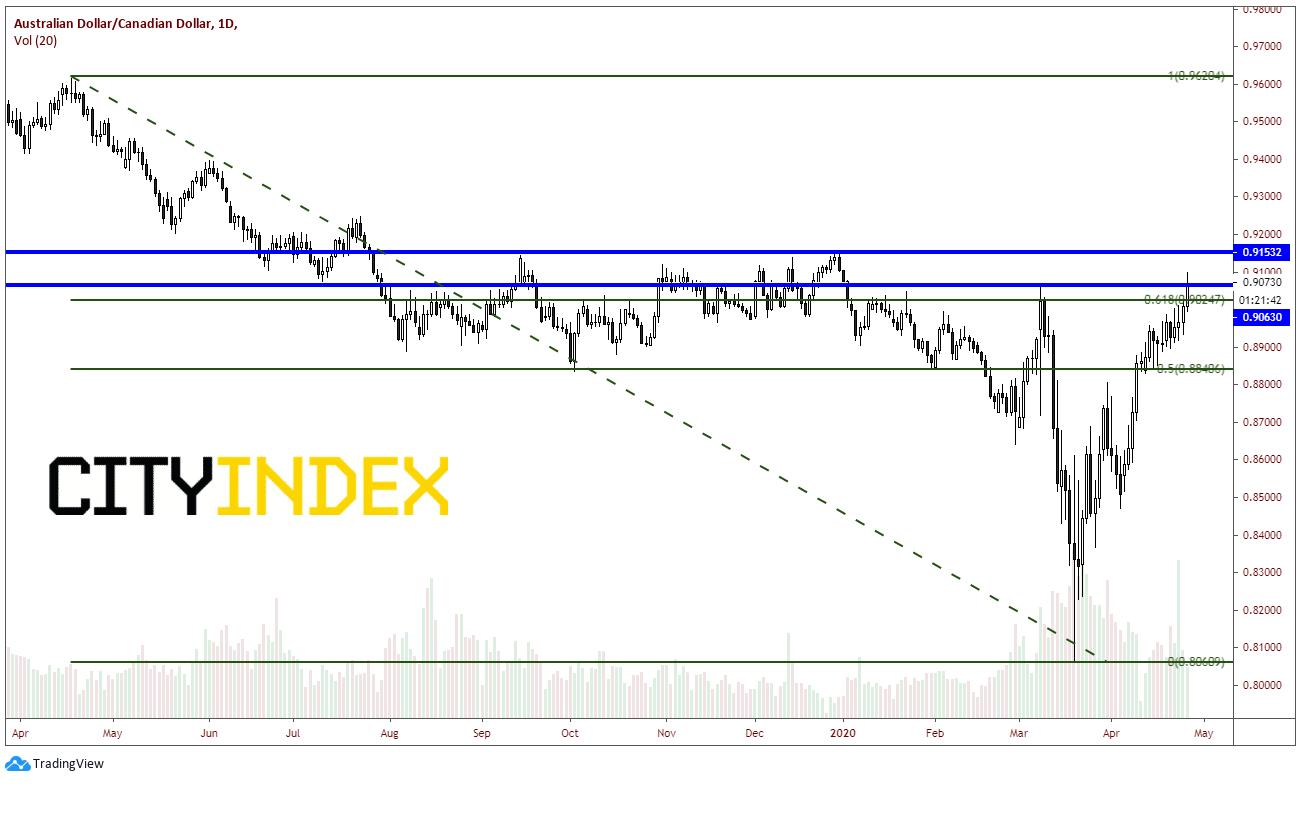
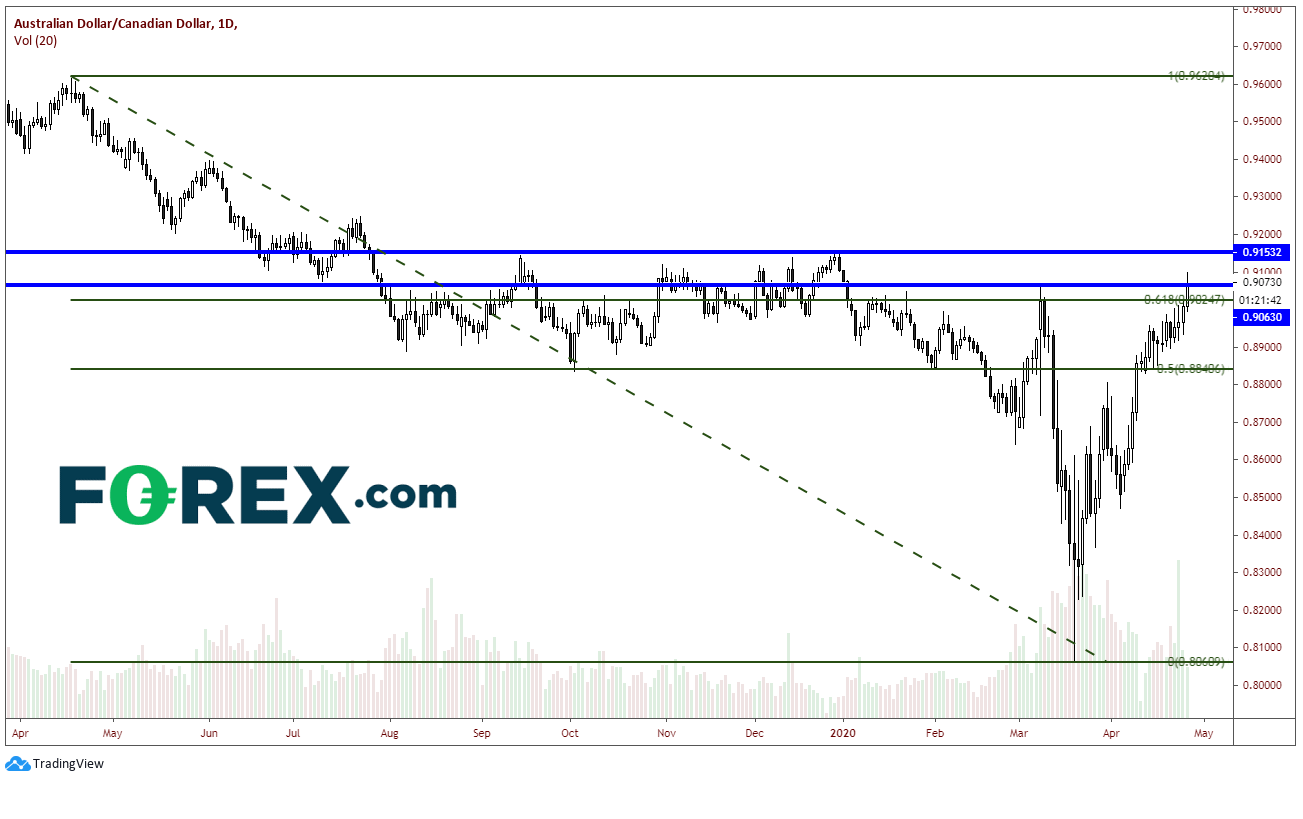
AUD/CAD has broken the 61.8 Fibonacci retracement level from April 17th, 2019 to the lows of March 19th near .9024 and above recent highs from March 9th at .9060. Next resistance level is .9150.
Source: Tradingview, City Index
GBP/AUD
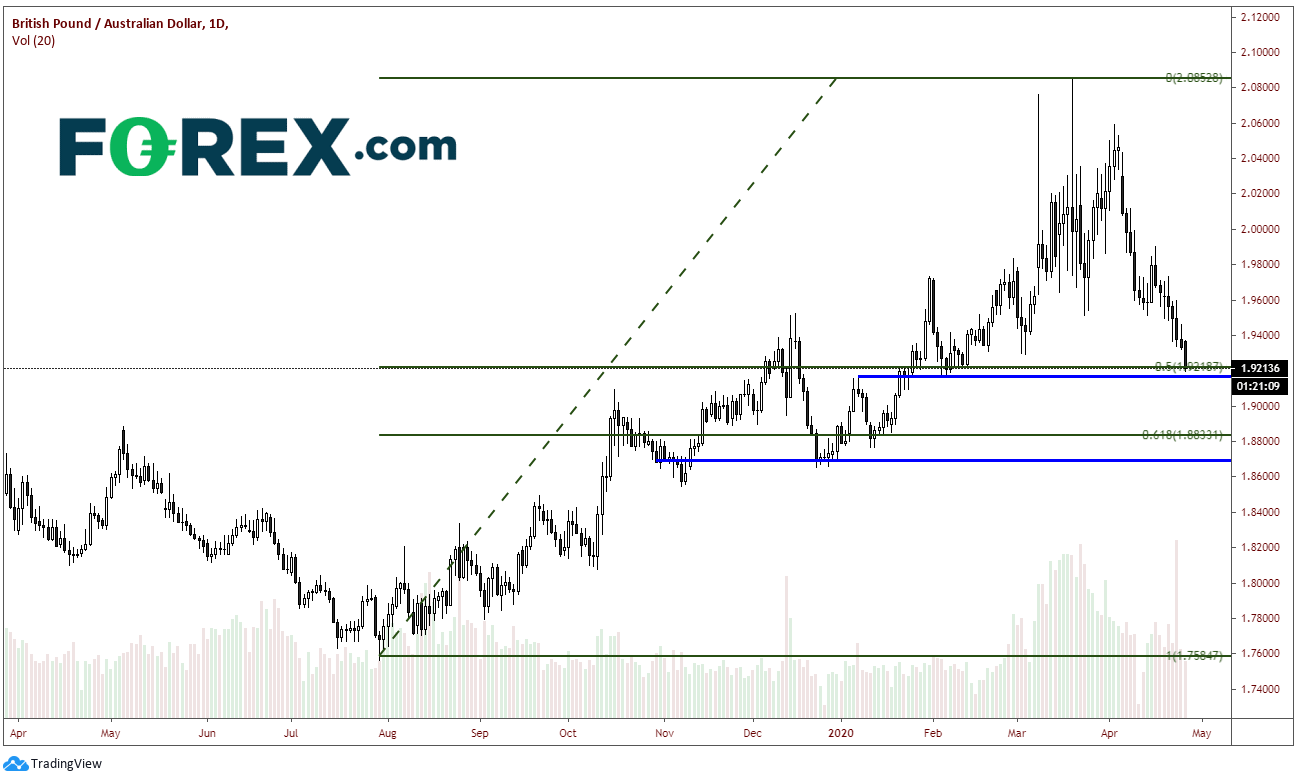
GBP/AUD is currently testing support at the 50% retracement level from the July 29th, 2019 lows to the March 19th highs, near 1.9218. There is immediate horizontal support also at that level. If break breaks lower, if can quickly run down to the 61.8% Fibonacci retracement level from that same timeframe near 1.8833.
Source: Tradingview, City Index
If one is looking to trade the S&P 500, however doesn’t want to expose themselves to the equity markets, the Australian Dollar is a comparative asset to trade. Looking at the Australian Dollar pairs, many are at key levels and may be ready for a good, old-fashioned squeeze!
Generally, when stocks up, the Australian Dollar goes up with them. Often we refer to the correlation coefficient and how it can be used to help determine the possible direction of one asset based on its correlation with another asset. In this case, the S&P 500 and the AUD/USD have a +.95 correlation coefficient. A correlation of +1.00 means that the 2 assets move perfectly together 100% of the time. Therefore, a correlation coefficient of +.95 is pretty close.
Source: Tradingview, CME, FOREX.com
Notice on the chart above how the S&P 500 is trying to break above the recent highs of 2885 from April 17th. That level is just below the phycological resistance of 2900 and the 61.8% retracement from the February 20th highs to the March 23rd lows at 2933. Think about how many people may have gotten short near these levels. That may actually be the reason stocks pulled back on April 20th and 21st. Now, think about where those traders may have put their stops. Buyers that were in the market on a quiet day may ultimately be trying to push stocks higher to eventually take out those stops! This is known as a squeeze - the market is squeezing the shorts out of the market! (And what a perfect week to try and do it with companies such as AMNZ and MSFT reporting this week)
If someone is looking to trade the S&P 500, either as a long looking for new highs or a short with stops above 2933, but would rather do it via a currency pair, a pair to consider is the AUD/USD. The pair already has a squeeze of its own taking place, which given the correlation coefficient, should help drag stocks higher with it. The AUD/USD has broken through horizontal resistance, prior highs and is currently trading just above the 61.8% Fibonacci retracement level from the December 31st, 2019 highs to the March 18th lows near .6455. The next resistance level about isn’t until .6660.
Source: Tradingview, FOREX.com
Many other Australian Dollar currency pairs are breaking through key levels and could squeeze further. Below are a few examples:
AUD/JPY
AUD/JPY is trading just above the 61.8% Fibonacci retracement from the highs of February 20th to the lows of March 19th and trying to fill the gap resistance from March 6th near 69.60.
Source: Tradingview, FOREX.com
AUD/CAD
AUD/CAD has broken the 61.8 Fibonacci retracement level from April 17th, 2019 to the lows of March 19th near .9024 and above recent highs from March 9th at .9060. Next resistance level is .9150.
Source: Tradingview, FOREX.com
GBP/AUD
GBP/AUD is currently testing support at the 50% retracement level from the July 29th, 2019 lows to the March 19th highs, near 1.9218. There is immediate horizontal support also at that level. If break breaks lower, if can quickly run down to the 61.8% Fibonacci retracement level from that same timeframe near 1.8833.
Source: Tradingview, FOREX.com
If one is looking to trade the S&P 500, however doesn’t want to expose themselves to the equity markets, the Australian Dollar is a comparative asset to trade. Looking at the Australian Dollar pairs, many are at key levels and may be ready for a good, old-fashioned squeeze!
Latest market news




The complete CFD trading experience
Award-winning platforms, competitive spreads, low commissions and dedicated support.
We live and breathe the markets and are dedicated to helping traders realise their ambitions as we continue to set the industry bar.
Economic calendar
Web Trader platform
Our sophisticated web-based platform is packed with features.
Related articles
EUR/USD Q4 2026 Outlook: Euro at a Crossroads as Fed, ECB Tighten 9 25 2026
EUR/USD enters Q4 at a pivotal inflection point as competing Fed-ECB policy paths and persistent inflation risks collide with major technical support.


USD/JPY Q4 2026 Outlook: Hawkish Fed Pricing Clashes With Intervention Risk
The year-end tug-of-war is clear: hawkish Fed pricing supports USD/JPY, while intervention risk limits the upside.


Japanese Yen Forecast: USD/JPY 4% Rally Challenges Post-Intervention Downtrend 9 24 2026
USD/JPY momentum has shifted sharply higher, putting a major resistance confluence in focus as U.S. and Japanese event risk builds.
StoneX Europe Ltd may make third party material available on this website which may contain information included but not limited to the conditions of financial markets. The material is for information purposes only and does not contain, and should not be construed as containing, investment advice and/or investment recommendation and/or an investment research and/or an offer of or solicitation for any transactions in financial instruments; any decision to enter into a specific transaction shall be made by the client following an assessment by him/her of their situation.
StoneX Europe Ltd makes no representation or warranty and assumes no liability as to the accuracy or completeness of the information provided, nor any loss arising from any investment based on a recommendation, forecast or other information supplied. You should always seek independent advice as to your suitability to speculate in any related markets and your ability to assume the associated risks, if you are at all unsure. We are not under any obligation to update any such material. Any opinion made may be personal to the author and may not reflect the opinion of StoneX Europe Ltd.