



STI Could Breakout (if CNH Allows)
We’re taking a longer-term technical look at the Singapore’s STI (Straights Times Index) as its rally has approached a key level of resistance.
Share this:


We can see on the weekly chart that the STI is within a 5-wave impulsive move which began at the March 2020 low. Wave 3 stalled at a 127.2% Fibonacci ratio and Feb 2020 high, and may have since completed a 3-wave correction. We suspect the correction is complete as it held above 3,000 (significant round number), the May low and 200/50 week eMA’s.
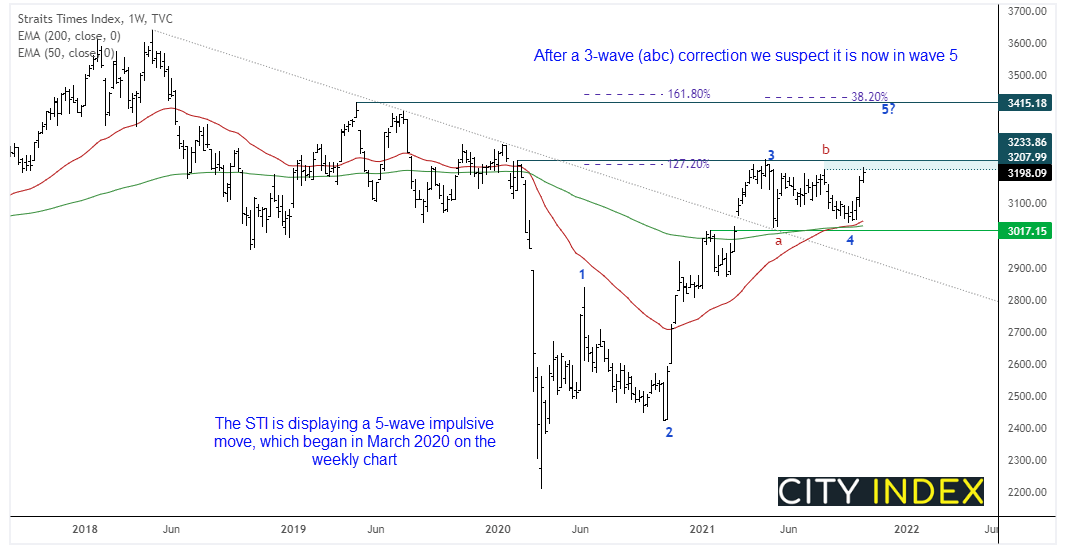
Furthermore, as bullish momentum has now realigned with wave-3, we’re now anticipating an eventual break above 3224 on its way to our wave-5 target around 3400. The target coincides with the April 2019 high and 38.2% expansion. However, there may be reason to suspect it may not break higher immediately and instead pull back from current levels beforehand.
Correlations matter
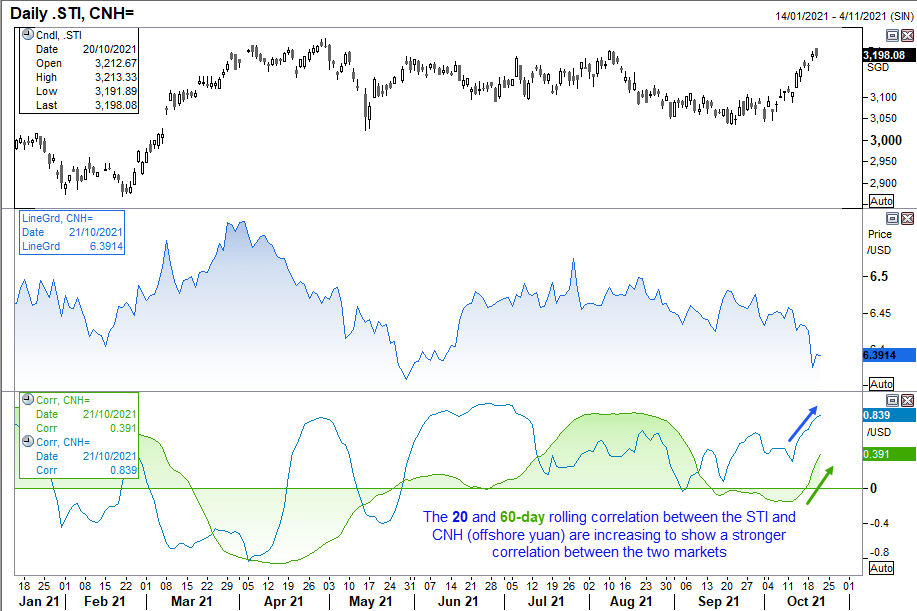
If we look at the relationship between the STI and USD/CNH, they share an inverted correlation. It is not perfect, but good enough to see a relationship exists over the longer-term. CNH is offshore Yuan, and if it increases in strength (USD/CNH moves lower) then it can be supportive of Asian markets such as the STI as CNH flows into them. However, by using a correlation indicator of the two markets we also note that the rolling 1-month (20 day) and 3-month (60-day) correlations are increasing which show the relationship has become increasingly stronger over recent weeks.
It is therefore worth noting that CNH is approaching a key level of support at 6.35 and, if it holds (at least initially), it suggests that STI may stall or retrace from the nearby resistance zone.
If USD/CNH bounces, STI could retrace

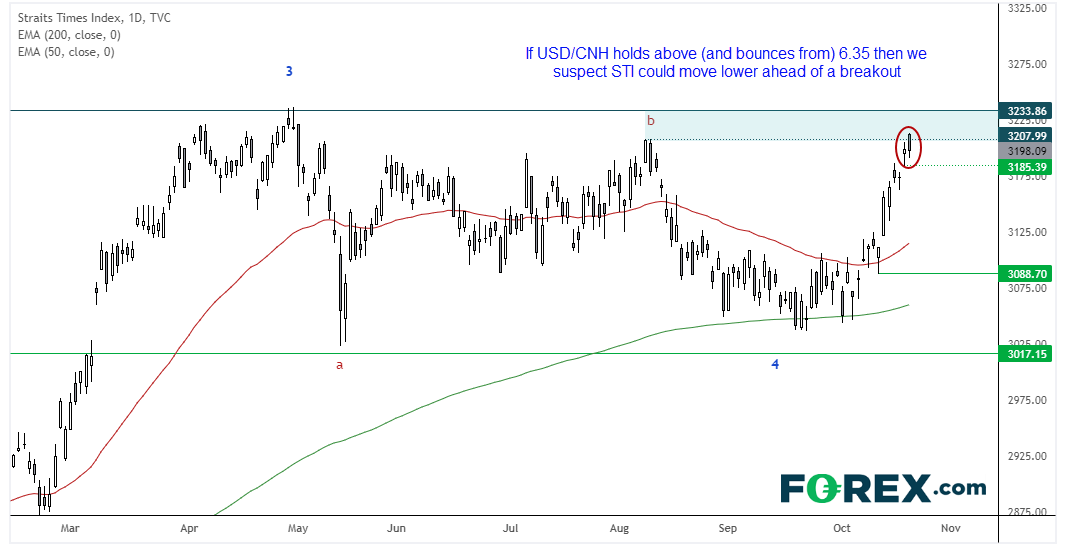
The daily chart shows its rally has stalled at the lower bound of a resistance zone. A spinning top Doji and 2-bar reversal (Dark Cloud cover) suggest near-term exhaustion on the daily chart, and a move lower could be a higher probability event should USD/CNH bounce from support.
- A break below 3185 confirms a minor correction is underway against the daily trend.
- However, as the daily trend remains bullish above 3088 it leaves quite a bit of wriggle room for a retracement, should USD/CNH bounce considerably from current levels.
- Overall, we anticipate STI to eventually break above 3244 as part of its wave-5 move.
How to trade with City Index
You can trade easily trade with City Index by using these four easy steps:
- Open an account, or log in if you’re already a customer
• Open an account in the UK
• Open an account in Australia
• Open an account in Singapore
- Search for the company you want to trade in our award-winning platform
- Choose your position and size, and your stop and limit levels
- Place the trade
How to trade with FOREX.com
Follow these easy steps to start trading with FOREX.com today:
- Open a Forex.com account, or log in if you’re already a customer.
- Search for the pair you want to trade in our award-winning platform.
- Choose your position and size, and your stop and limit levels.
- Place the trade.
Related tags:
Latest market news




The complete CFD trading experience
Award-winning platforms, competitive spreads, low commissions and dedicated support.
We live and breathe the markets and are dedicated to helping traders realise their ambitions as we continue to set the industry bar.
Economic calendar
Web Trader platform
Our sophisticated web-based platform is packed with features.
Related articles
USD/JPY Forecast: Is Rising Japanese Inflation Supporting the Yen?
As the trading week comes to an end, one of the most relevant developments in the FX market has been the renewed strength of the Japanese yen. This can be seen in the recent performance of USD/JPY, which has fallen nearly 1.0% over the last two trading sessions, highlighting a meaningful recovery in the Japanese currency against the U.S. dollar.
Silver forecast: metals liquidation drags XAG/USD into $50-55 support
Silver has broken its July low and slipped into a long-term support zone as the selling in precious metals deepens. The chart shows where the metal could bottom, and next week's Fed decision may decide whether it does.

Australian Dollar Forecast: AUD/USD Support Reversal Sparks Monthly Range Breakout 10 23 2026
A sharp reversal off key support has fueled the AUD/USD recovery, with resistance now in focus ahead of next week’s Fed decision and Australian CPI.

StoneX Europe Ltd may make third party material available on this website which may contain information included but not limited to the conditions of financial markets. The material is for information purposes only and does not contain, and should not be construed as containing, investment advice and/or investment recommendation and/or an investment research and/or an offer of or solicitation for any transactions in financial instruments; any decision to enter into a specific transaction shall be made by the client following an assessment by him/her of their situation.
StoneX Europe Ltd makes no representation or warranty and assumes no liability as to the accuracy or completeness of the information provided, nor any loss arising from any investment based on a recommendation, forecast or other information supplied. You should always seek independent advice as to your suitability to speculate in any related markets and your ability to assume the associated risks, if you are at all unsure. We are not under any obligation to update any such material. Any opinion made may be personal to the author and may not reflect the opinion of StoneX Europe Ltd.