








Technical Tuesday: DAX, GOLD and AUD/NZD
Technical analysis on some of the most interesting markets right now
Share this:

Welcome to Technical Tuesday, a weekly report where we highlight some of the most interesting markets that will hopefully appease technical analysts and traders alike.
In this week’s edition, we are getting technical on the DAX, GOLD and AUD/NZD. So, there’s something for everyone.
1. DAX
Like many other global indices, the DAX has struggled to sustain any attempts to rally. Unlike before, the global central banks are now in a tightening phase, and this is discouraging investors from holding overvalued stocks and other assets. There are many other risks to consider as well, not least a slowdown in China where authorities have been putting large cities into lockdown to curb the latest wave of covid.
Traders on the other hand have been evidently happy to sit on the offer at resistance. As a result, we are continuing to see lower lows and lower highs form on the major indices. Insofar as the DAX is concerned, there is also a bearish trend line that has been formed, which has continually offered resistance to any bullish attempts. Equally significantly, the 21-day exponential moving average has been trending lower, providing a ceiling to the DAX on multiple occasions.
Specifically, it looks like the DAX is having a tough time around 14050. This level has acted as both support and resistance in the last couple of months on several occasions. But we are back below it today and also underneath the 21-day. In other words, the short-term technical bias is again bearish and will remain that way until and unless the DAX breaks cleanly above this area of resistance.
2. Gold
The precious metal has been far from being so precious in these high inflationary periods. Instead of acting as an inflation hedge and rally, it has fallen along with all other dollar-denominated commodities. Rising bond yields have also weighed on the price of this and other non-interest-bearing commodities.
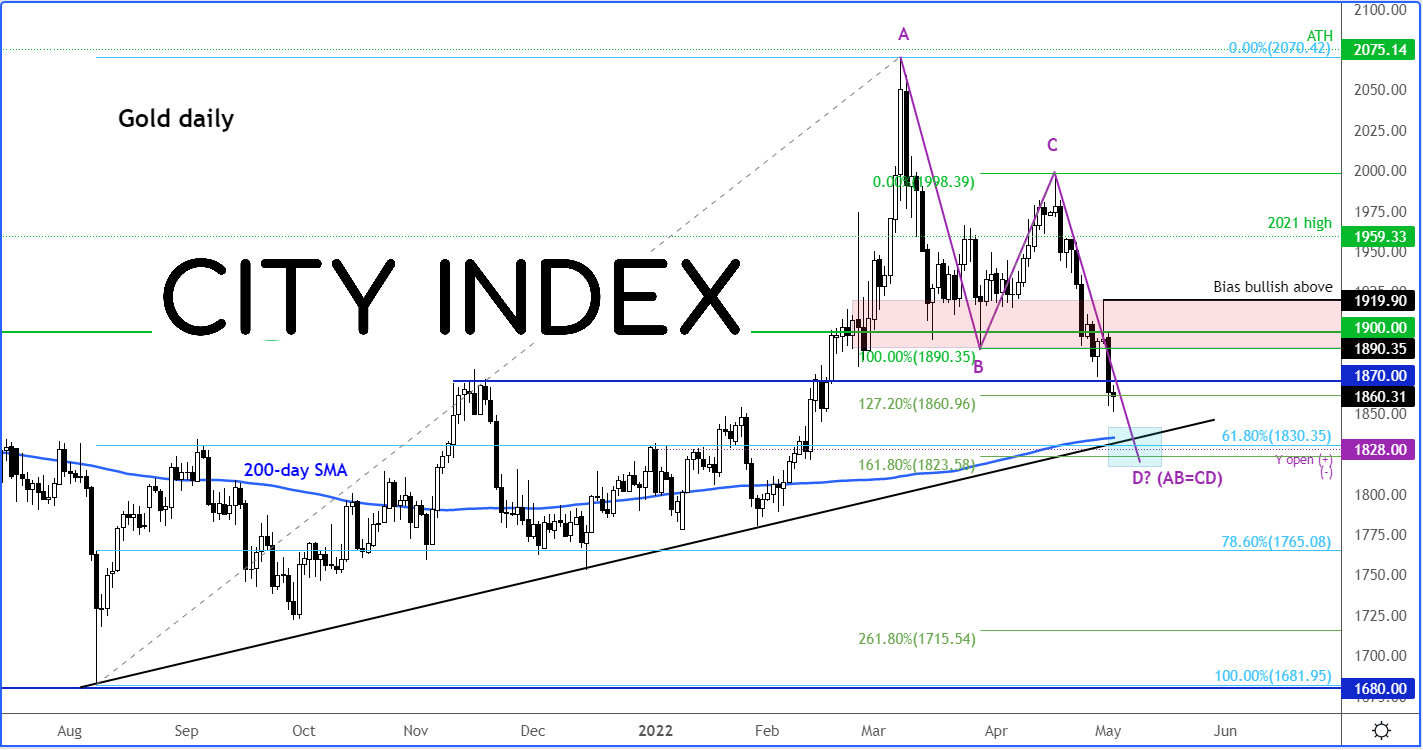
Gold’s breakdown below $1900 support was an addition blow to traders and investors alike, who were hoping that the metal could bottom out there. But all hope is not lost. The yellow metal is still holding its own above the technically important 200-day moving average, which comes in around $1835.
In fact, gold may be heading to a very important area of support, in this busy week of central bank action, with the Fed and BoE still to come. Specifically, the area around $1830 is significant because several technical factors converge here. As well as the 200-day average, we have a bullish trend line meeting the point D of an AB=CD price projection, and the 61.8% Fibonacci retracement against the rally from August.
If gold were to drop to the above zone, we would then like to see a sharp reaction that could potentially lift the price of gold back to former levels of support and resistance such as $1870 or $1900. If we don’t see such a reaction, then we wouldn’t rule out the potential for a much deeper correction.
Regardless of whether gold gets to that $1830ish area, the short-term bearish bias would end in the event of a rally above Friday’s high near $1920, for that would create a higher high on the chart of gold.
3. AUD/NZD
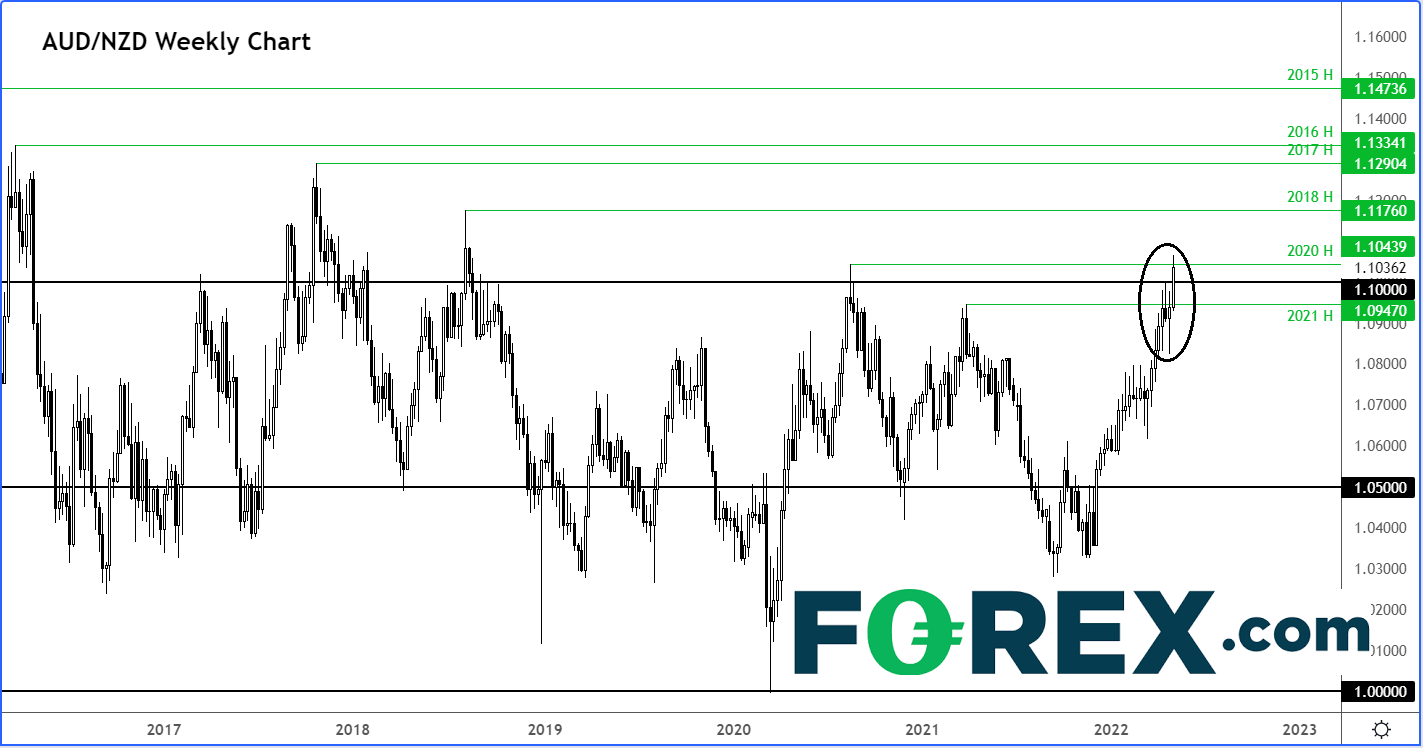
The AUD/NZD broke to its highest level since 2018 overnight after the Reserve Bank of Australia raised the Cash Rate by 25 basis points to 0.35% instead of 15 bps expected. The RBA governor Lowe has said that the economy has a lot of positive momentum, and that it can weather fairly small rate moves.
The trend was already bullish on the AUD/NZD prior to this latest breakout, as highlighted for example by the rising 21-day exponential moving average on the chart. But today’s breakout means fresh buyers will now be encouraged to step in on any short-term dips, potentially providing new energy for the currency pair to move to fresh multi-year highs in the days and weeks ahead.
The breakout has also seen the AUD/NZD take out a key level of resistance around 1.10, where it had previously run into trouble on multiple occasions. But the market is curious, and it will likely come back down to re-test 1.10 from above in the near future. It is now imperative that that breakout holds above 1.10 area, or thereabouts.
In light of the rate hike and hawkish commentary form the RBA, we would expect dips back to support level such as 1.10 to hold, and foresee further gains towards the prior years’ highs:
Previously…
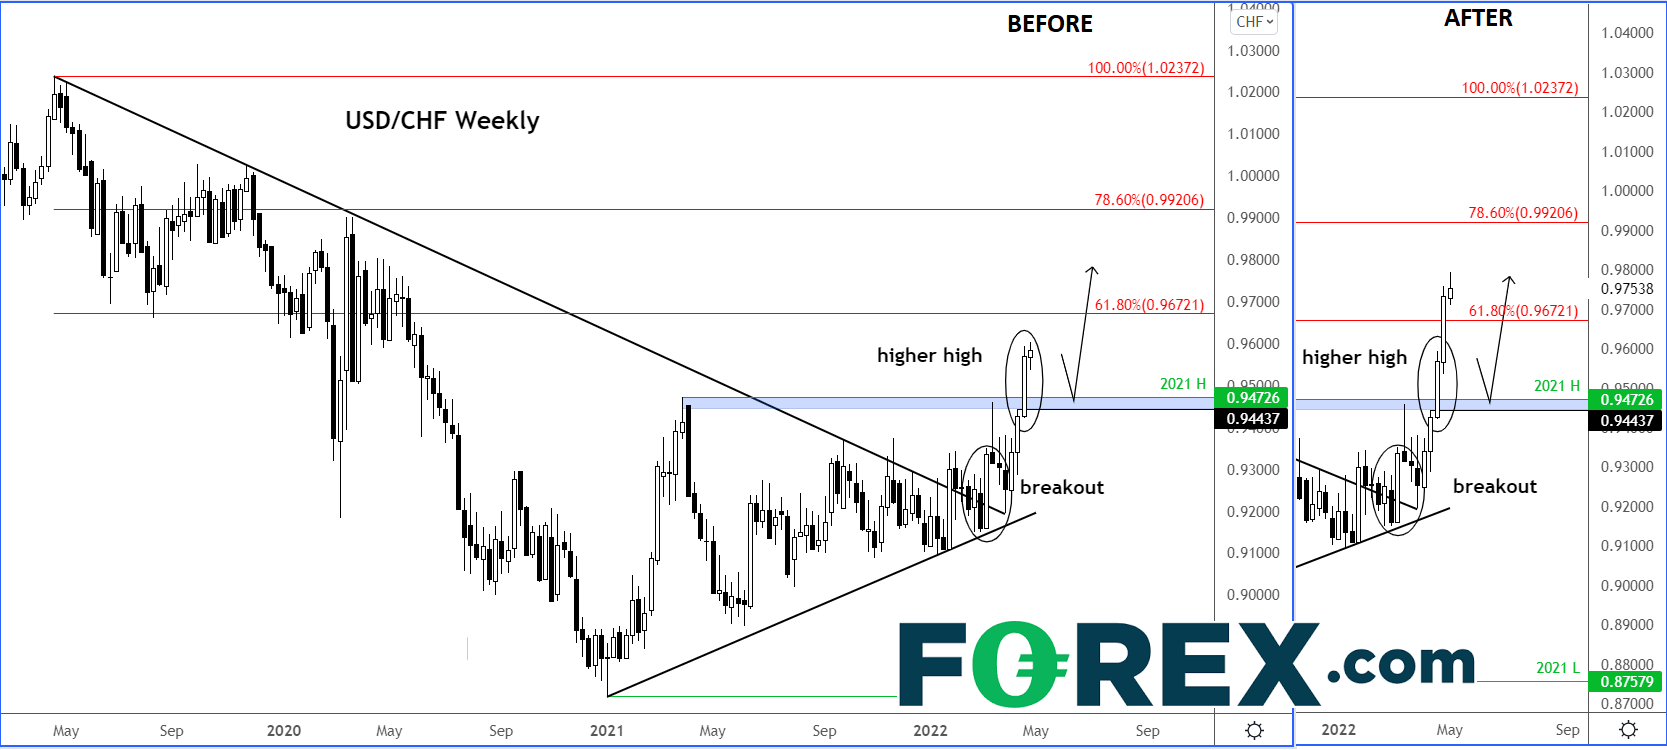
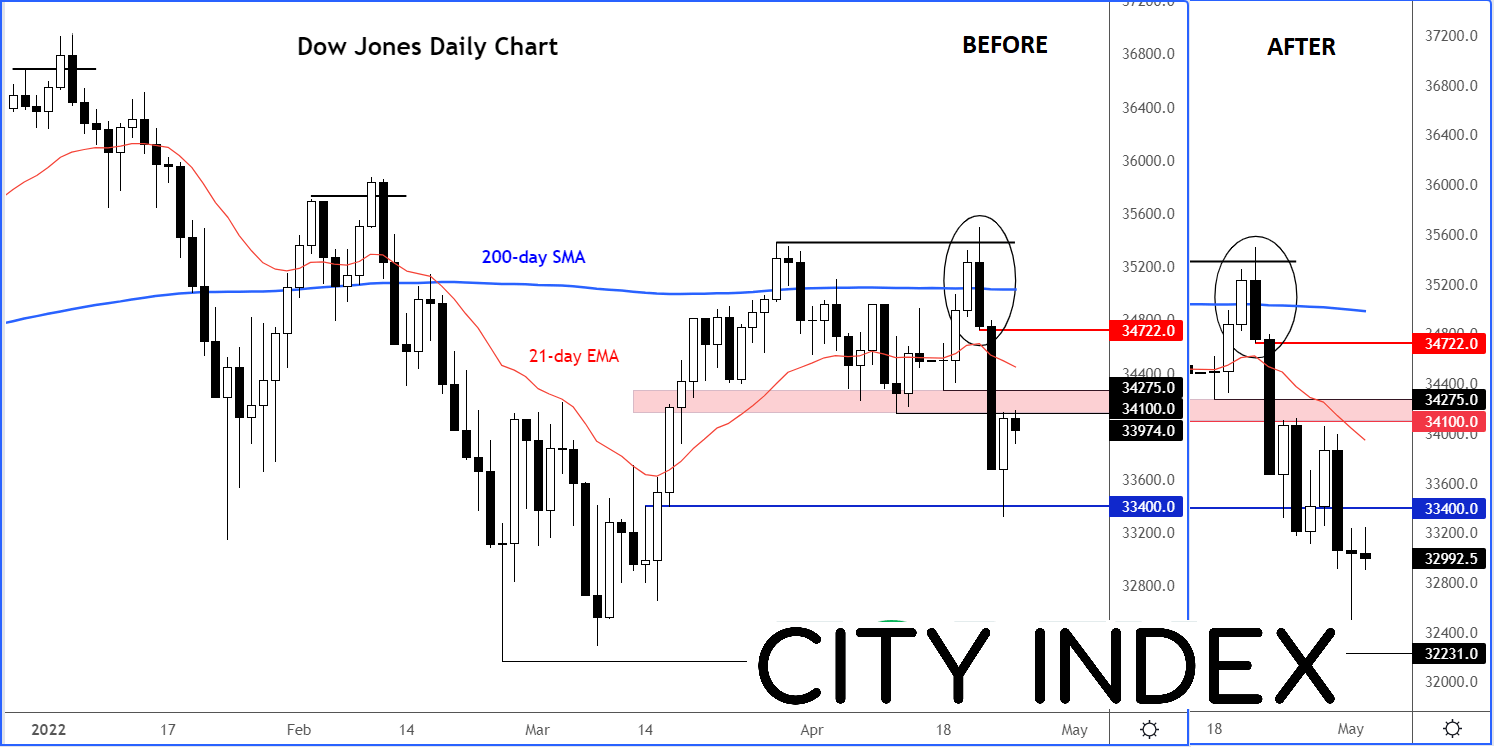
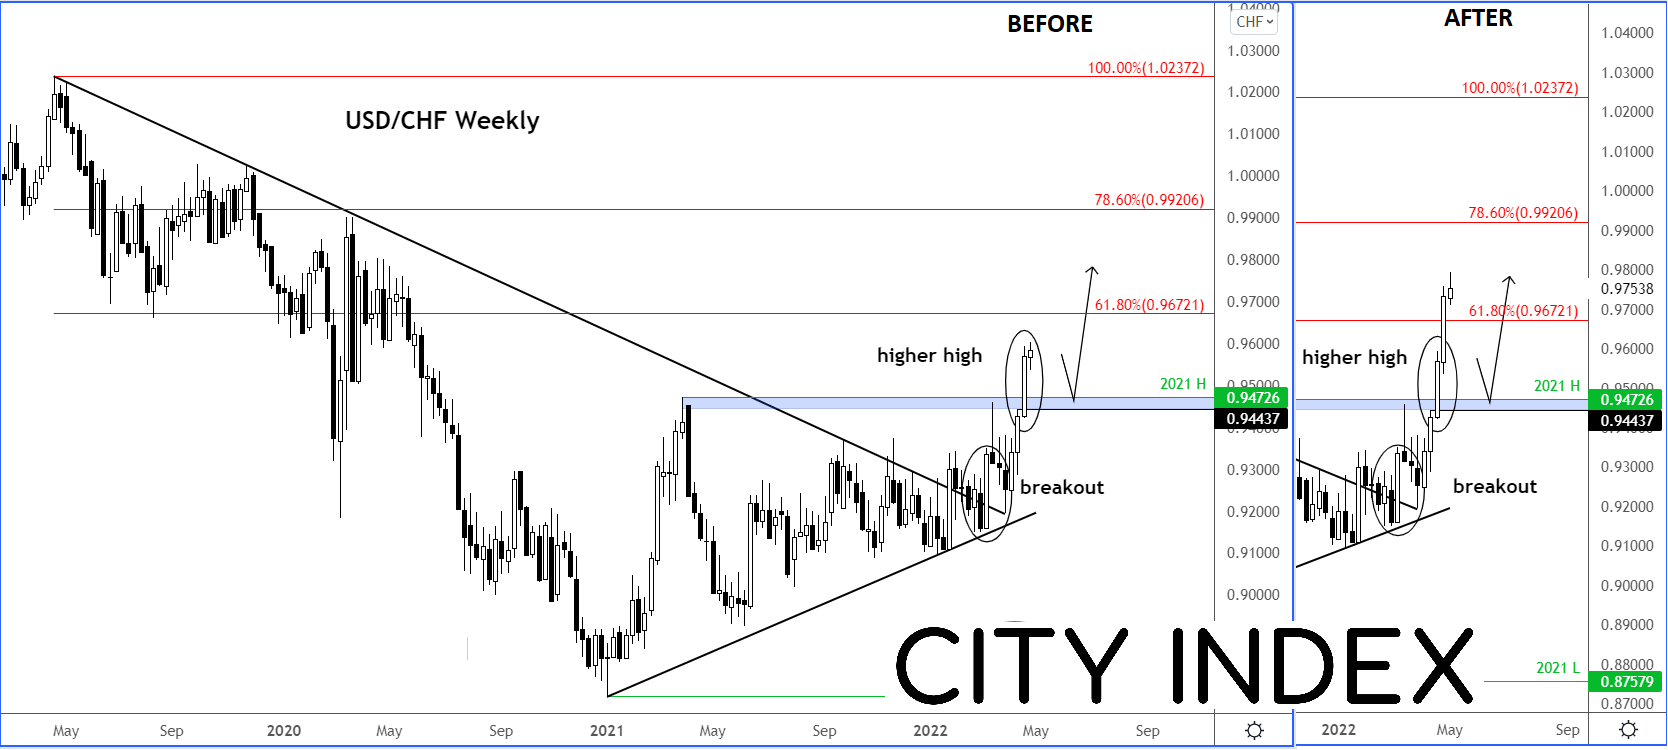
In the previous edition of the Technical Tuesday, we had covered the Dow Jones, USD/CHF and copper. A week on, here are the before and after charts for those markets:
Source for all charts used in this article: StoneX and TradingView.com
Welcome to Technical Tuesday, a weekly report where we highlight some of the most interesting markets that will hopefully appease technical analysts and traders alike.
In this week’s edition, we are getting technical on the DAX, GOLD and AUD/NZD. So, there’s something for everyone.
1. DAX
Like many other global indices, the DAX has struggled to sustain any attempts to rally. Unlike before, the global central banks are now in a tightening phase, and this is discouraging investors from holding overvalued stocks and other assets. There are many other risks to consider as well, not least a slowdown in China where authorities have been putting large cities into lockdown to curb the latest wave of covid.
Traders on the other hand have been evidently happy to sit on the offer at resistance. As a result, we are continuing to see lower lows and lower highs form on the major indices. Insofar as the DAX is concerned, there is also a bearish trend line that has been formed, which has continually offered resistance to any bullish attempts. Equally significantly, the 21-day exponential moving average has been trending lower, providing a ceiling to the DAX on multiple occasions.
Specifically, it looks like the DAX is having a tough time around 14050. This level has acted as both support and resistance in the last couple of months on several occasions. But we are back below it today and also underneath the 21-day. In other words, the short-term technical bias is again bearish and will remain that way until and unless the DAX breaks cleanly above this area of resistance.
2. Gold
The precious metal has been far from being so precious in these high inflationary periods. Instead of acting as an inflation hedge and rally, it has fallen along with all other dollar-denominated commodities. Rising bond yields have also weighed on the price of this and other non-interest-bearing commodities.
Gold’s breakdown below $1900 support was an addition blow to traders and investors alike, who were hoping that the metal could bottom out there. But all hope is not lost. The yellow metal is still holding its own above the technically important 200-day moving average, which comes in around $1835.
In fact, gold may be heading to a very important area of support, in this busy week of central bank action, with the Fed and BoE still to come. Specifically, the area around $1830 is significant because several technical factors converge here. As well as the 200-day average, we have a bullish trend line meeting the point D of an AB=CD price projection, and the 61.8% Fibonacci retracement against the rally from August.
If gold were to drop to the above zone, we would then like to see a sharp reaction that could potentially lift the price of gold back to former levels of support and resistance such as $1870 or $1900. If we don’t see such a reaction, then we wouldn’t rule out the potential for a much deeper correction.
Regardless of whether gold gets to that $1830ish area, the short-term bearish bias would end in the event of a rally above Friday’s high near $1920, for that would create a higher high on the chart of gold.
3. AUD/NZD
The AUD/NZD broke to its highest level since 2018 overnight after the Reserve Bank of Australia raised the Cash Rate by 25 basis points to 0.35% instead of 15 bps expected. The RBA governor Lowe has said that the economy has a lot of positive momentum, and that it can weather fairly small rate moves.

The trend was already bullish on the AUD/NZD prior to this latest breakout, as highlighted for example by the rising 21-day exponential moving average on the chart. But today’s breakout means fresh buyers will now be encouraged to step in on any short-term dips, potentially providing new energy for the currency pair to move to fresh multi-year highs in the days and weeks ahead.
The breakout has also seen the AUD/NZD take out a key level of resistance around 1.10, where it had previously run into trouble on multiple occasions. But the market is curious, and it will likely come back down to re-test 1.10 from above in the near future. It is now imperative that that breakout holds above 1.10 area, or thereabouts.
In light of the rate hike and hawkish commentary form the RBA, we would expect dips back to support level such as 1.10 to hold, and foresee further gains towards the prior years’ highs:
Previously…
In the previous edition of the Technical Tuesday, we had covered the Dow Jones, USD/CHF and copper. A week on, here are the before and after charts for those markets:
Source for all charts used in this article: StoneX and TradingView.com
How to trade with City Index
You can trade with City Index by following these four easy steps:
- Open an account, or log in if you’re already a customer
• Open an account in the UK
• Open an account in Australia
• Open an account in Singapore
- Search for the company you want to trade in our award-winning platform
- Choose your position and size, and your stop and limit levels
- Place the trade
Related tags:
Latest market news




The complete CFD trading experience
Award-winning platforms, competitive spreads, low commissions and dedicated support.
We live and breathe the markets and are dedicated to helping traders realise their ambitions as we continue to set the industry bar.
Economic calendar
Web Trader platform
Our sophisticated web-based platform is packed with features.
Related articles
EUR/USD weekly outlook: Oil, inflation and NFP in focus
After coming under significant pressure in recent weeks, the EUR/USD came off its lows to finish the week on a positive note on Friday, albeit with only a mild rebound. That was not enough to prevent the exchange rate falling for the third consecutive week, as the US dollar and bond yields rallied across the board.
Gold Q4 2026 outlook: Resilience in the face of rallying dollar and yields
As we headed towards the latter stages of Q3 and into Q4, the Fed had just hiked rates in a hawkish FOMC meeting, while the likes of the ECB and BoJ had also tightened their respective policies. Oil prices remained elevated amid the prolonged US-Iran conflict. Meanwhile, bond yields were breaking out, and the dollar was higher across the board. Yet, remarkably, gold was still holding in the positive territory for the third quarter, even if it had weakened somewhat in September.

EUR/USD Q4 2026 Outlook: Euro at a Crossroads as Fed, ECB Tighten 9 25 2026
EUR/USD enters Q4 at a pivotal inflection point as competing Fed-ECB policy paths and persistent inflation risks collide with major technical support.

StoneX Europe Ltd may make third party material available on this website which may contain information included but not limited to the conditions of financial markets. The material is for information purposes only and does not contain, and should not be construed as containing, investment advice and/or investment recommendation and/or an investment research and/or an offer of or solicitation for any transactions in financial instruments; any decision to enter into a specific transaction shall be made by the client following an assessment by him/her of their situation.
StoneX Europe Ltd makes no representation or warranty and assumes no liability as to the accuracy or completeness of the information provided, nor any loss arising from any investment based on a recommendation, forecast or other information supplied. You should always seek independent advice as to your suitability to speculate in any related markets and your ability to assume the associated risks, if you are at all unsure. We are not under any obligation to update any such material. Any opinion made may be personal to the author and may not reflect the opinion of StoneX Europe Ltd.