



The FTSE China A50 Index Could Become the China A100
As economies develop and investors needs change over time, so can the makeup of an equity index. Just as the DAX 30 became the DAX recently, the China A50 may also receive an upgrade.
Share this:



The FTSE China A50 is a tradable index which comprises of 50 of the largest A-Shares according to market capitalisation. It is frequently used as a hedging tool by international traders who seek protection for their Chinese equity exposure. In response to investor feedback, the index may be revamped to include the 100 largest companies listed in Shanghai and Shenzhen to offer broader protection for overseas hedgers. However, the move is also likely to be to counter the launch of the MSCI China A50 Connect Index last month, the first product of its kind by HKEX (Hong Kong Exchanges and Clearing Limited).


We can see the performance over the past 3-months of the 10-largest companies within the index has been quite mixed. Kweichow Moutai (600519), which accounts for around 1% of the A50 has been effectively flat over this period. Like the A50 is has pulled back from the October high but could be forming a bullish wedge formation on the daily chart, although we are not yet convinced the bullish reversal pattern has seen its final low. Meanwhile, Ping An Insurance (601318), which accounts for around 9% of the A50 has fallen over 20% which places it in a technical bear market. Overall, this tilts us to a bearish bias on the China A50 over the near-term.
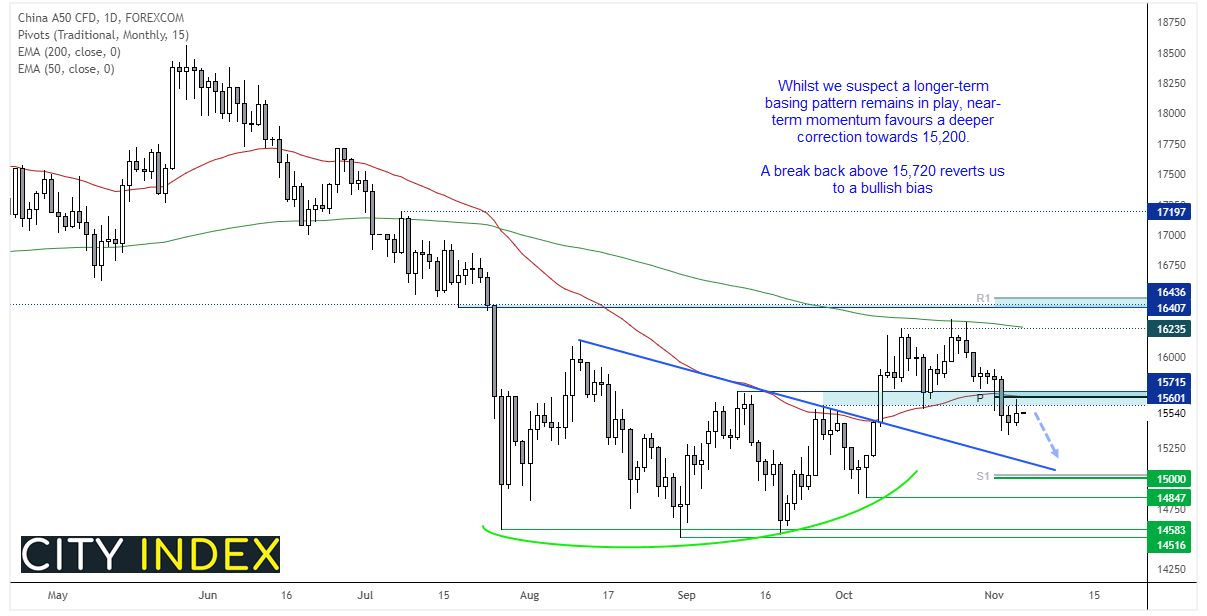

We can see on the daily chart that the China A50 has carved out a basing pattern around 14500 before breaking trend support. A bullish divergence occurred over this period to further suggest a longer-term reversal was forming. However, the index remains in a countertrend move since it failed to break above 16,400 and 200-day eMA.
- With prices now back beneath the monthly pivot point and 50-day eMA, we have a bearish-bias below 15,715 over the near-term.
- We are now looking for the retracement to bottom out above 15,000 or somewhere along the broken trendline.
- Given the long-term basing pattern and buy-signal on the weekly MACD, we expect prices to eventually break above 16,400 resistance once the current corrective phase is complete.
- A break back above 15,715 switches our near-term bias to bullish.
How to trade with City Index
You can trade easily trade with City Index by using these four easy steps:
- Open an account, or log in if you’re already a customer
• Open an account in the UK
• Open an account in Australia
• Open an account in Singapore
- Search for the company you want to trade in our award-winning platform
- Choose your position and size, and your stop and limit levels
- Place the trade
How to trade with FOREX.com
Follow these easy steps to start trading with FOREX.com today:
- Open a Forex.com account, or log in if you’re already a customer.
- Search for the pair you want to trade in our award-winning platform.
- Choose your position and size, and your stop and limit levels.
- Place the trade.



The complete CFD trading experience
Award-winning platforms, competitive spreads, low commissions and dedicated support.
We live and breathe the markets and are dedicated to helping traders realise their ambitions as we continue to set the industry bar.
Economic calendar
Web Trader platform
Our sophisticated web-based platform is packed with features.
Related articles
USD/CAD shooting star puts September surge on notice
USD/CAD has printed a clear bearish reversal pattern after an extraordinary September surge, but confirmation may depend heavily on how US Treasury yields react to Friday’s payrolls report.

Gold Price Forecast: XAU/USD Plunges 12.4% Toward Critical Support 10 1 2026
Softer inflation has revived expectations for a Fed pause, but Friday’s payrolls could put gold’s recovery prospects to the test.


US Dollar Technical Outlook: DXY Bulls Meet Resistance at Yearly Highs 10 1 2026
The U.S. Dollar has held firm despite fading Fed hike bets, but Friday’s payrolls could test the rally’s staying power.
StoneX Europe Ltd may make third party material available on this website which may contain information included but not limited to the conditions of financial markets. The material is for information purposes only and does not contain, and should not be construed as containing, investment advice and/or investment recommendation and/or an investment research and/or an offer of or solicitation for any transactions in financial instruments; any decision to enter into a specific transaction shall be made by the client following an assessment by him/her of their situation.
StoneX Europe Ltd makes no representation or warranty and assumes no liability as to the accuracy or completeness of the information provided, nor any loss arising from any investment based on a recommendation, forecast or other information supplied. You should always seek independent advice as to your suitability to speculate in any related markets and your ability to assume the associated risks, if you are at all unsure. We are not under any obligation to update any such material. Any opinion made may be personal to the author and may not reflect the opinion of StoneX Europe Ltd.