



‘Tis the season to be quantitative: ASX 200
December is upon us, a month that is usually associated with Santa’s rally. So we’ve decided to take a closer look at the data to see if it is true.
Share this:

Santa’s rally is the festive name applied to the tendency for equity markets to rally in the final weeks of December. It doesn’t always happen, but it occurs frequently enough for the pattern to be quite apparent and can be seen as a nice little boost to sentiment ahead of the festive period.
How has the ASX 200 historically performed on a monthly basis?
To begin, we’ll look at how the ASX 200 has performed each month since inception. The ASX 200 was officially launched in March 2001, although the data set used includes artificially reconstructed data back to 1992 which provides a larger sample size to work with. Whilst statistical theory says we need at least 30 data points for a data set to be deemed ‘statistically significant’, we think 29 years is close enough, and it does provide some interesting patterns.


- December has historically been its second most profitable month, averaging a return of 2.01%.
- Its most profitable month has been April and averaged a 2.4% return.
- In recent years (over the past 5 and 10-years) December’s average returns have been lower.
- Over this same period the ASX has posted stronger average returns in July.
However, an average return doesn’t necessarily mean a higher probability of a positive month. Average returns hide outliers which can skew the data (for better or worse). Therefore we prefer to focus on months which have a higher ‘win rate’ (positive closes over 50%) alongside average positive returns.

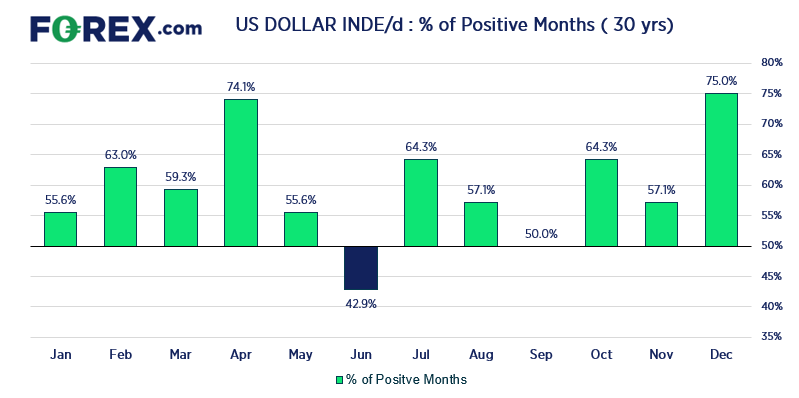
This table shows the ASX ‘win rate’, which show the % of time the month has posted a gain.
- December has the highest win rate compared to any other month, with a win rate of 75% (or lose rate 25%).
- April has the second highest win rate of 74.1%.
- July has the strongest average return with the joint- third highest win rate at 64.3%.
- September has posted negative returns on average and has closed higher 50% of the time, effectively making it a flip of a coin with a negative bias (not great odds).
- June has posted average negative returns with a win rate below 50% (it has closed lower 57.1% of the time)
What Santa’s rally looks like on the ASX 200

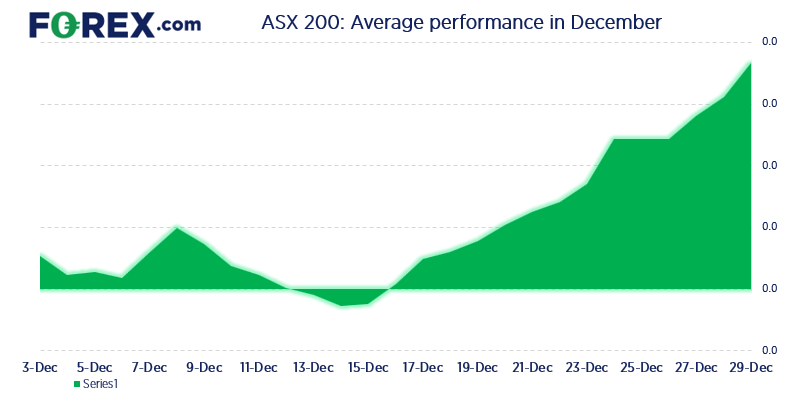
If there was ever an example of a textbook Santa’s rally, this chart would be it. It displays the average performance of the ASX 200 throughout December.
- Price action is generally choppy in the first half of December
- The rally has typically begun around the middle of December and rallied into the year-end close
- A bullish ‘bump’ has also formed ahead of Christmas.
- Please note that dates need to be taken with a pinch of salt but it does provide a general overview for how it has performed overall in December.
A word of caution with seasonal charts
we should also point out that seasonal charts are not a roadmap to the future, as they are simply averages of the past. There will be some months that completely ignore their seasonal tendency, as global macro or index-specific micro themes crop up and become a key driver to push prices in unpredictable ways. Therefore, this information should be filed under ‘nice to know’ and simply used to complement one’s own analysis whether it be technical or fundamental analysis. Besides, at the time of writing we have the new covid-19 variant to contend with which has the potential to unhinge the global recovery and drag equity markets down with it.
ASX 200 rallies above 7300
It looks like the ASX 200 could be headed for a strong close today. Monday’s decline was quick to reach our target around 7200, and its low found support at the 200-day eMA before reversing to print a potential ‘buyers tail’ by yesterday’s close. Prices rallied form today’s open and a close above 7300 would be constructive indeed.


If it were to close the week around current levels it would form a bullish hammer on the weekly chart, so anything above current levels makes it appear the more bullish heading into next week. For now our bias remains bullish above this week’s low, but with covid headlines likely to weigh on sentiment then we’ll allow for some choppy trade (unless the new variant doesn’t lead to restrictions).
Related analysis:
- Remember, the VIX doesn't stay high for long
- How has the S&P 500 historically performed on Thanksgiving
Related analysis:
How to trade with City Index
You can easily trade with City Index by using these four easy steps:
- Open an account, or log in if you’re already a customer
• Open an account in the UK
• Open an account in Australia
• Open an account in Singapore
- Search for the company you want to trade in our award-winning platform
- Choose your position and size, and your stop and limit levels
- Place the trade
How to trade with FOREX.com
Follow these easy steps to start trading with FOREX.com today:
- Open a Forex.com account, or log in if you’re already a customer.
- Search for the pair you want to trade in our award-winning platform.
- Choose your position and size, and your stop and limit levels.
- Place the trade.
Related tags:
Latest market news




The complete CFD trading experience
Award-winning platforms, competitive spreads, low commissions and dedicated support.
We live and breathe the markets and are dedicated to helping traders realise their ambitions as we continue to set the industry bar.
Economic calendar
Web Trader platform
Our sophisticated web-based platform is packed with features.
Related articles
USD/JPY Q4 2026 Outlook: Hawkish Fed Pricing Clashes With Intervention Risk
The year-end tug-of-war is clear: hawkish Fed pricing supports USD/JPY, while intervention risk limits the upside.
Japanese Yen Forecast: USD/JPY 4% Rally Challenges Post-Intervention Downtrend 9 24 2026
USD/JPY momentum has shifted sharply higher, putting a major resistance confluence in focus as U.S. and Japanese event risk builds.


S&P 500 forecast: Stocks extend drop as correction risks grow
US and global equity markets have extended Wednesday’s sell-off, with Wall Street opening lower after a weak handover from Asia and Europe. The deterioration in risk appetite has been spreading across global markets. The dollar was firmer, Treasury yields were holding onto yesterday’s gains, while gold, silver and bitcoin were all under pressure alongside equities and major currencies.

StoneX Europe Ltd may make third party material available on this website which may contain information included but not limited to the conditions of financial markets. The material is for information purposes only and does not contain, and should not be construed as containing, investment advice and/or investment recommendation and/or an investment research and/or an offer of or solicitation for any transactions in financial instruments; any decision to enter into a specific transaction shall be made by the client following an assessment by him/her of their situation.
StoneX Europe Ltd makes no representation or warranty and assumes no liability as to the accuracy or completeness of the information provided, nor any loss arising from any investment based on a recommendation, forecast or other information supplied. You should always seek independent advice as to your suitability to speculate in any related markets and your ability to assume the associated risks, if you are at all unsure. We are not under any obligation to update any such material. Any opinion made may be personal to the author and may not reflect the opinion of StoneX Europe Ltd.