



Turkey’s inflation data may embolden Erdogan
The inflation print beat expectations of 20.4% YoY, possibly because of the 200bps rate cut on October 21st!
Share this:

At the Central Bank of Turkey’s last meeting, members decided to cut the interest from by 200bps, from 18% to 16%. Expectations were for a cut of only 50bps. They did this even though inflation rose to 19.58%, its highest level since March 2019. Why did they do this? As my colleague Matt Weller pointed out, Turkey’s President Erdogan dismissed several of the central bank’s governors, including the only one who opposed a cut at the previous meeting. He replaced them with 3 handpicked successors and predictably, they cut rates. However, they cut my much more than expected.
Today, Turkey released inflation data for October. The headline number was 19.89% YoY, slightly higher than September’s print of 19.58% YoY. This is the highest reading since January 2019. However, the inflation print beat expectations of 20.4% YoY, possibly because of the 200bps rate cut on October 21st! The Central Bank of Turkey meets again on November 18th. Based on the rate cut at the previous meeting, one could assume the 3 replaced governors will do as Erdogan wishes. Will the inflation beat give Erdogan a feeling confidence to cut interest rates again at the next meeting (although, of course, it’s not his decision)?
Trade USD/TRY now: Login or open a new account!
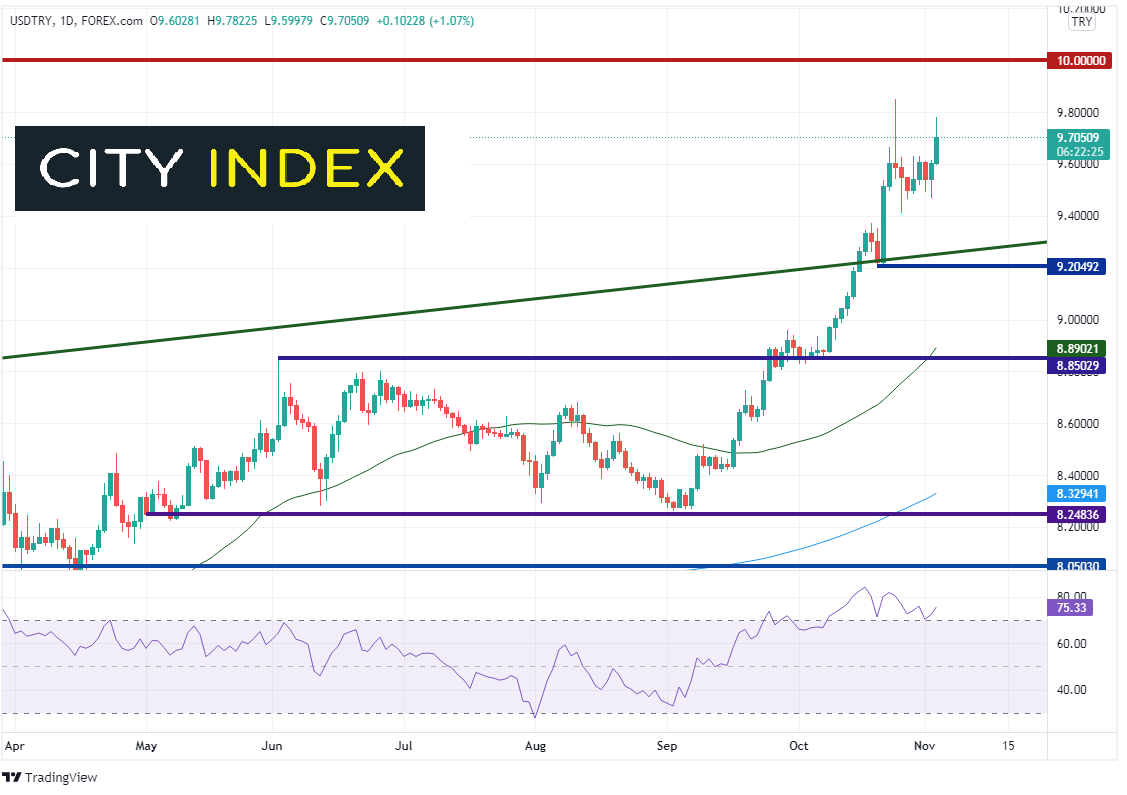
The weaker inflation data pushed USD/TRY to near all-time highs set on October 25th, at 9.8496. On that day, price action formed a shooting star candlestick which indicated the pair was ready for a possible pullback, especially with the RSI in overbought territory and diverging from price! However, the pair thus far has beaten the analytics and traded as high as 9.7823 today.

Source: Tradingview, Stone X
On a 240-minute timeframe, above the highs from October 25th, resistance is at the convergence of the 127.2% Fibonacci extension from the October 25th highs to the October 26th lows near 9.9844 and the psychological round number of 10.0000. The next resistance is at 161.8% Fibonacci extension from the same timeframe near 10.1353. Support is at the convergence of the October 26th lows and an upward sloping trendline dating back to mid-September near 9.4297, then the October 20th lows at 9.2049.

Source: Tradingview, Stone X
With Erdogan (unofficially) at the helm of the Central Bank of Turkey, today’s inflation data may give him reassurance that he is doing the right thing by having the central bank governors lower interest rates. However, if expectations are for more rate cuts, watch for USD/TRY push for stops above 10.000!
Learn more about forex trading opportunities.
At the Central Bank of Turkey’s last meeting, members decided to cut the interest from by 200bps, from 18% to 16%. Expectations were for a cut of only 50bps. They did this even though inflation rose to 19.58%, its highest level since March 2019. Why did they do this? As my colleague Matt Weller pointed out, Turkey’s President Erdogan dismissed several of the central bank’s governors, including the only one who opposed a cut at the previous meeting. He replaced them with 3 handpicked successors and predictably, they cut rates. However, they cut my much more than expected.
Today, Turkey released inflation data for October. The headline number was 19.89% YoY, slightly higher than September’s print of 19.58% YoY. This is the highest reading since January 2019. However, the inflation print beat expectations of 20.4% YoY, possibly because of the 200bps rate cut on October 21st! The Central Bank of Turkey meets again on November 18th. Based on the rate cut at the previous meeting, one could assume the 3 replaced governors will do as Erdogan wishes. Will the inflation beat give Erdogan a feeling confidence to cut interest rates again at the next meeting (although, of course, it’s not his decision)?
Trade USD/TRY now: Login or Open a new account!
• Open an account in the UK
• Open an account in Australia
• Open an account in Singapore
The weaker inflation data pushed USD/TRY to near all-time highs set on October 25th, at 9.8496. On that day, price action formed a shooting star candlestick which indicated the pair was ready for a possible pullback, especially with the RSI in overbought territory and diverging from price! However, the pair thus far has beaten the analytics and traded as high as 9.7823 today.
Source: Tradingview, Stone X
On a 240-minute timeframe, above the highs from October 25th, resistance is at the convergence of the 127.2% Fibonacci extension from the October 25th highs to the October 26th lows near 9.9844 and the phycological round number of 10.0000. The next resistance is at 161.8% Fibonacci extension from the same timeframe near 10.1353. Support is at the convergence of the October 26th lows and an upward sloping trendline dating back to mid-September near 9.4297, then the October 20th lows at 9.2049.

Source: Tradingview, Stone X
With Erdogan (unofficially) at the helm of the Central Bank of Turkey, today’s inflation data may give him reassurance that he is doing the right thing by having the central bank governors lower interest rates. However, if expectations are for more rate cuts, watch for USD/TRY push for stops above 10.000!
Learn more about forex trading opportunities.
Related tags:


The complete CFD trading experience
Award-winning platforms, competitive spreads, low commissions and dedicated support.
We live and breathe the markets and are dedicated to helping traders realise their ambitions as we continue to set the industry bar.
Economic calendar
Web Trader platform
Our sophisticated web-based platform is packed with features.
Related articles
Gold forecast: Rising yields become too hot for gold, but the outlook is far from bearish
Gold and silver prices took a plunge today, with the former down 3% and the latter falling some 5% by mid European session, before bouncing off their lows. The losses come after the metals remained largely supported until last week, despite the big dollar rally and surging bond yields as we have seen in recent weeks. But it simply got too much, and the metals succumbed to pressure today.

USD into a Massive Week as Yields Fly and Gold Breaks
It’s a huge week with PCE and NFP, but it’s what’s happening off of the calendar that demands attention with US yields flying to fresh multi-decade highs.


USDJPY Forecast Intervention Fears Clash with Dollar Strength
Recent trading sessions have produced mixed results for the Japanese yen. By the end of last week, USD/JPY had fallen by more than 1.00%, reflecting a modest recovery in the yen. However, the start of this week has seen the pair move slightly back in favor of the U.S. dollar, posting gains of around 0.04%.

StoneX Europe Ltd may make third party material available on this website which may contain information included but not limited to the conditions of financial markets. The material is for information purposes only and does not contain, and should not be construed as containing, investment advice and/or investment recommendation and/or an investment research and/or an offer of or solicitation for any transactions in financial instruments; any decision to enter into a specific transaction shall be made by the client following an assessment by him/her of their situation.
StoneX Europe Ltd makes no representation or warranty and assumes no liability as to the accuracy or completeness of the information provided, nor any loss arising from any investment based on a recommendation, forecast or other information supplied. You should always seek independent advice as to your suitability to speculate in any related markets and your ability to assume the associated risks, if you are at all unsure. We are not under any obligation to update any such material. Any opinion made may be personal to the author and may not reflect the opinion of StoneX Europe Ltd.