






US CPI a NonEvent Powell Up Next
The Question and Answer to follow will be just as important as the text itself!
Share this:

US CPI was released earlier today as the headline number MoM for October came in stronger than expected at 0.4% vs 0.3% expected and 0.0 in September. However, the more important component of the data was the release of US Core CPI YoY. This is one of the major data points which the Fed watches to get a better gauge of true inflation as it excludes food and energy prices. The US Core CPI YoY for October was slightly weaker at 2.3% vs 2.4% expected and 2.4% last. Note that this figure is still above the Fed’s target rate for inflation of 2.0%.
Speaking of the Fed, today Fed Chairman Powell is set to speak today at 11:00am EST in front of the Joint Economic Committee (JEC) to give the Fed’s updated views of the US Economy. Chairman Powell stated recently that the economy “is in a good place”. Markets will be looking to see if he echoes these comments today. If so, this will confirm the FOMC’s sentiment that interest rates are on hold for the time being. The CME FedWatch Tool is currently pricing in a 96% chance of the FOMC leaving rates unchanged at its December 11th meeting.
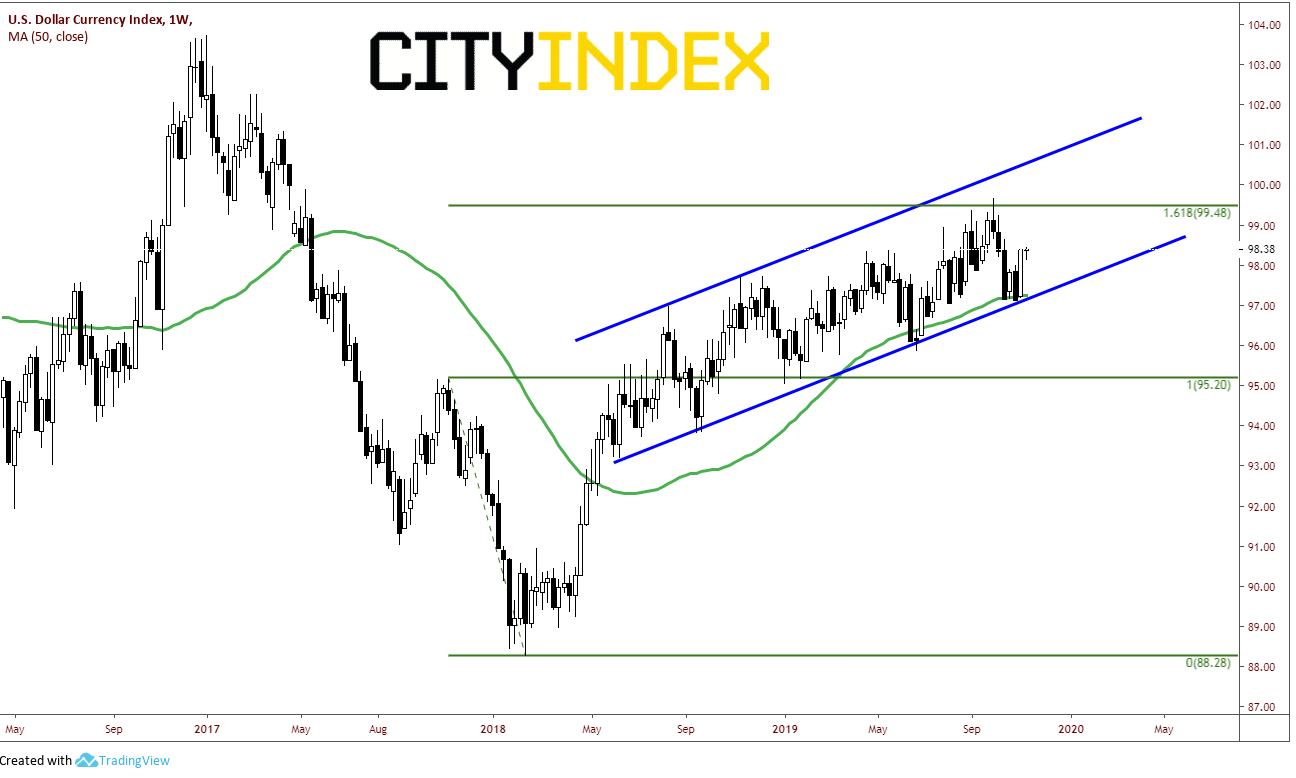
The US Dollar Index (DXY), in particular, will be paying attention to any signs from Powell of a change an expected change in inflation and employment. On a weekly chart, price as been trading in an upward sloping channel since May 2018. Price tried to break lower out of the channel a few weeks ago, however ran into support and was rejected at the upward sloping bottom trendline of the channel and the 50-week moving average.
Source: Tradingview, City Index
On a daily timeframe, we can see clearly that the DXY formed a flag near the lows and tried to break lower through the channel support and the 200-day moving average, only to fail as bulls gained control and turned it higher back into the channel range.
Source: Tradingview, City Index
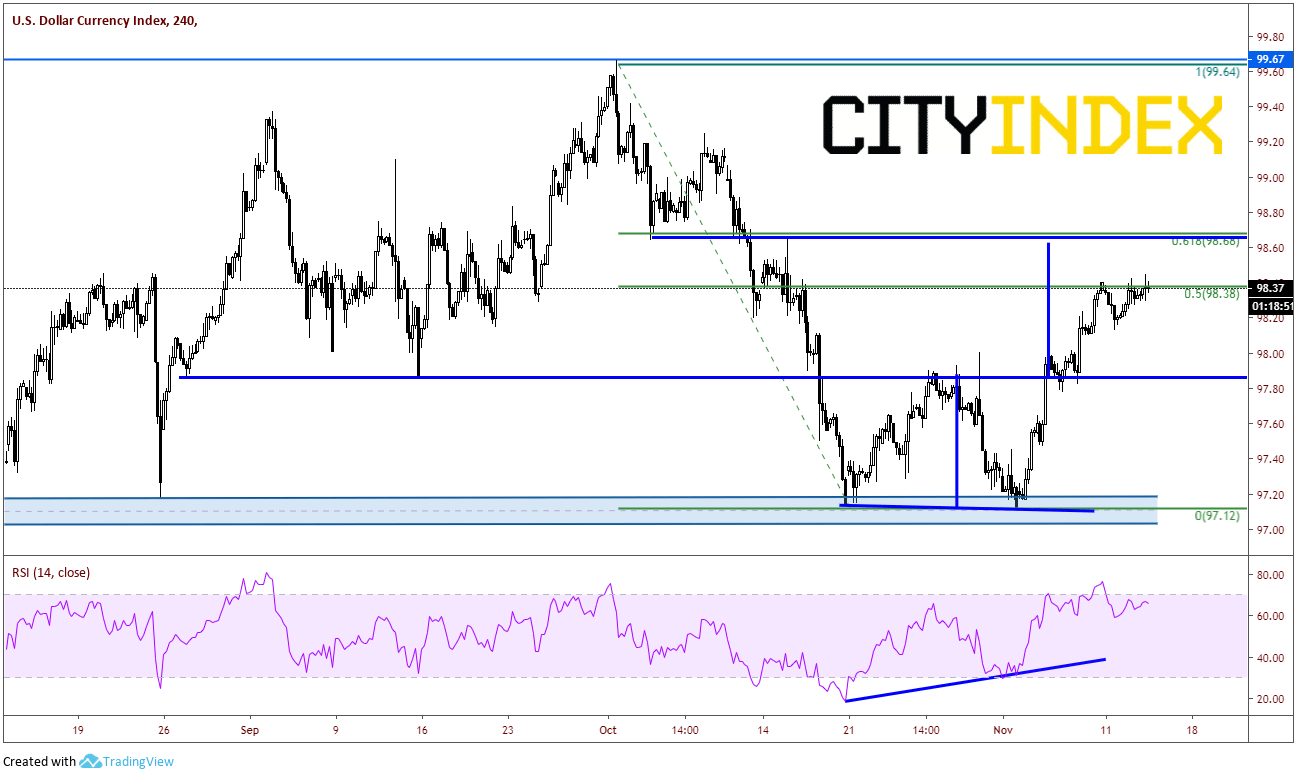
On a 240-minute chart, price put in a double bottom at the lows near 97.15. The target for a double bottom is the height of the pattern added to the breakout point. This level of 98.60 coincides with previous support (which now acts as resistance) as well as the 61.8% Fibonacci retracement of the highs on October 1st to the lows on November 1st. Price has currently stalked near 98.38, near the 50% retracement of the previously mentioned timeframe. Horizonal support below near the breakout point at 97.87.
Source: Tradingview, City Index
Watch for the text of Powell’s statement to be released before the actual testimony. The Question and Answer session to follow will most likely be just as important as the text itself!
US CPI was released earlier today as the headline number MoM for October came in stronger than expected at 0.4% vs 0.3% expected and 0.0 in September. However, the more important component of the data was the release of US Core CPI YoY. This is one of the major data points which the Fed watches to get a better gauge of true inflation as it excludes food and energy prices. The US Core CPI YoY for October was slightly weaker at 2.3% vs 2.4% expected and 2.4% last. Note that this figure is still above the Fed’s target rate for inflation of 2.0%.
Speaking of the Fed, today Fed Chairman Powell is set to speak today at 11:00am EST in front of the Joint Economic Committee (JEC) to give the Fed’s updated views of the US Economy. Chairman Powell stated recently that the economy “is in a good place”. Markets will be looking to see if he echoes these comments today. If so, this will confirm the FOMC’s sentiment that interest rates are on hold for the time being. The CME FedWatch Tool is currently pricing in a 96% chance of the FOMC leaving rates unchanged at its December 11th meeting.
The US Dollar Index (DXY), in particular, will be paying attention to any signs from Powell of a change an expected change in inflation and employment. On a weekly chart, price as been trading in an upward sloping channel since May 2018. Price tried to break lower out of the channel a few weeks ago, however ran into support and was rejected at the upward sloping bottom trendline of the channel and the 50-week moving average.
Source: Tradingview, FOREX.com
On a daily timeframe, we can see clearly that the DXY formed a flag near the lows and tried to break lower through the channel support and the 200-day moving average, only to fail as bulls gained control and turned it higher back into the channel range.
Source: Tradingview, FOREX.com
On a 240-minute chart, price put in a double bottom at the lows near 97.15. The target for a double bottom is the height of the pattern added to the breakout point. This level of 98.60 coincides with previous support (which now acts as resistance) as well as the 61.8% Fibonacci retracement of the highs on October 1st to the lows on November 1st. Price has currently stalked near 98.38, near the 50% retracement of the previously mentioned timeframe. Horizonal support below near the breakout point at 97.87.
Source: Tradingview, FOREX.com
Watch for the text of Powell’s statement to be released before the actual testimony. The Question and Answer session to follow will most likely be just as important as the text itself!
Latest market news




The complete CFD trading experience
Award-winning platforms, competitive spreads, low commissions and dedicated support.
We live and breathe the markets and are dedicated to helping traders realise their ambitions as we continue to set the industry bar.
Economic calendar
Web Trader platform
Our sophisticated web-based platform is packed with features.
Related articles
AUD/USD Analysis: What's Next for the Australian Dollar After the RBA Decision?
Recent trading sessions have reflected a more neutral tone around the Australian dollar. This can be seen in AUD/USD price action, which has posted moves of roughly 0.2% over the last two sessions without establishing a clear direction. Much of this lack of momentum is linked to expectations surrounding the next policy moves from both the Reserve Bank of Australia (RBA) and the Federal Reserve.
USD into a Massive Week as Yields Fly and Gold Breaks
It’s a huge week with PCE and NFP, but it’s what’s happening off of the calendar that demands attention with US yields flying to fresh multi-decade highs.

USDJPY Forecast Intervention Fears Clash with Dollar Strength
Recent trading sessions have produced mixed results for the Japanese yen. By the end of last week, USD/JPY had fallen by more than 1.00%, reflecting a modest recovery in the yen. However, the start of this week has seen the pair move slightly back in favor of the U.S. dollar, posting gains of around 0.04%.
StoneX Europe Ltd may make third party material available on this website which may contain information included but not limited to the conditions of financial markets. The material is for information purposes only and does not contain, and should not be construed as containing, investment advice and/or investment recommendation and/or an investment research and/or an offer of or solicitation for any transactions in financial instruments; any decision to enter into a specific transaction shall be made by the client following an assessment by him/her of their situation.
StoneX Europe Ltd makes no representation or warranty and assumes no liability as to the accuracy or completeness of the information provided, nor any loss arising from any investment based on a recommendation, forecast or other information supplied. You should always seek independent advice as to your suitability to speculate in any related markets and your ability to assume the associated risks, if you are at all unsure. We are not under any obligation to update any such material. Any opinion made may be personal to the author and may not reflect the opinion of StoneX Europe Ltd.