



USD/JPY to Range Support as EUR/JPY, GBP/JPY Coil
USD/JPY has been in a somewhat consistent range for more than a month now, even as USD-weakness has shown in many other FX markets. But EUR/JPY and GBP/JPY may still have a more compelling case for JPY trends.
Share this:

USD/JPY, EUR/JPY, GBP/JPY Talking Points:
- USD bears have given another push today on the heels of the US CPI report and jobless claims data, and notably EUR/USD has rallied at a key spot on the chart following a comment from Christine Lagarde at the ECB rate decision.
- USD/JPY remains in a range, however, with support coming back into play this morning after the release of CPI data. This keeps the door open for bulls and that can counter the USD-weakness setup in EUR/USD quite well. Alternatively, traders can look to remove the USD from that equation by focusing on EUR/JPY, which has so far held support at a big Fibonacci level. And on a similar note, GBP/JPY continues to test the 200.00 level with prospect of continued breakout.
- I look into each of USD/JPY, EUR/JPY and GBP/JPY during the weekly webinar, and you’re welcome to join the next. Click here to register.

USD/JPY continues to trade in a well-defined range with this morning’s USD weakness prodding a move from short-term resistance down to longer-term support. While it’s still difficult to get too excited about a directional movement out of this impasse, the deduction that USD/JPY has held up quite well even with a continued sell-off in the USD highlights a theme of Yen-weakness that could potentially be put to use elsewhere.
As I’ve been saying, both EUR/JPY and GBP/JPY can make for a more compelling argument behind Yen-weakness and that fact seems to remain in force, as of this writing.
Nonetheless, price action is objective and since the sell-off after the NFP report in early-August, USD/JPY has been very range bound, with a threat for bullish breakout getting snuffed out last week following rejection at the 200-day moving average.
At this point, if looking for USD-weakness, I think there are simply more attractive venues as the higher-lows in USD/JPY since April remain in-place. If that changes, so could the opinion for bearish setups in USD/JPY.
At this point, range support runs between Fibonacci levels at 146.95 and 147.14, with short-term resistance at 147.94-148.13. Above that, there’s another Fibonacci level at 148.51 and that’s followed by a zone running from 149.23-149.39.
For deeper support, there’s a trendline that’s nearing confluence with the late-July swing low at 145.86.
USD/JPY Daily Chart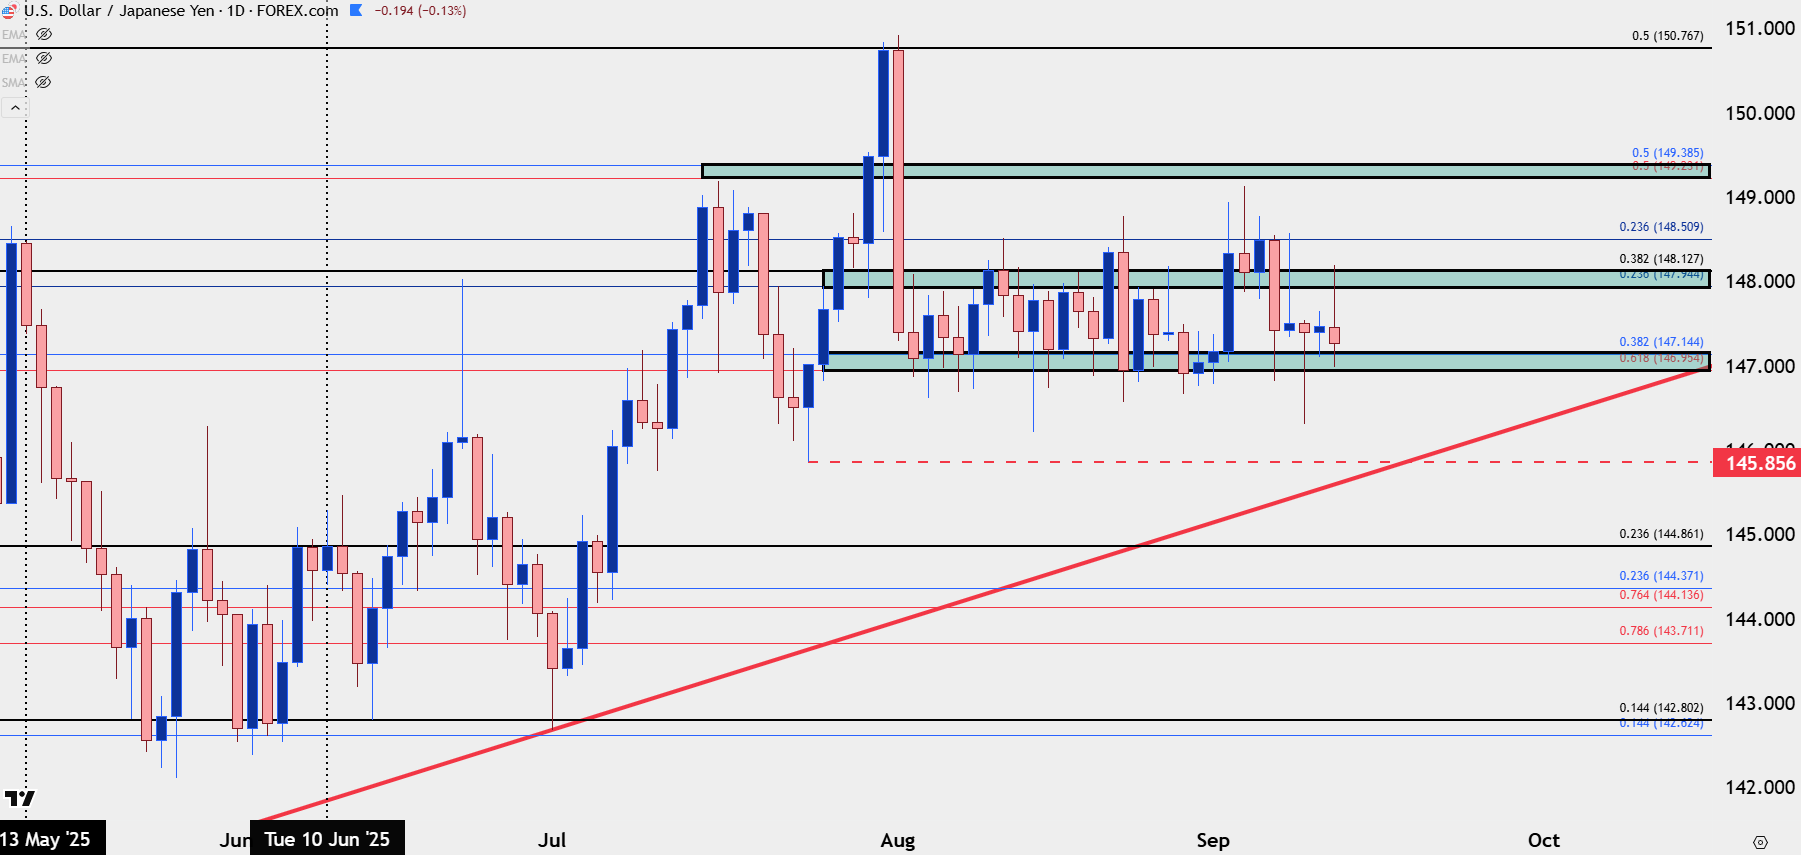
Chart prepared by James Stanley; data derived from Tradingview
EUR/JPY
EUR/JPY remains in a possible breakout scenario given the second hold of resistance at 173.90 on Monday of this week. From the daily chart, an ascending triangle formation is setting up with that horizontal resistance coupled with higher lows, and there’s also support coming in from a key Fibonacci level of 172.30, which is the 61.8% retracement of the late-July pullback in the pair.
The deviation from the above horizontal range in USD/JPY highlights the addition of Euro-strength, and as I wrote earlier this morning, Christine Lagarde’s statement that disinflation was over for the Eurozone could put fundamental favor behind the single currency, especially as the U.S. nears the start of a rate cutting cycle.
EUR/JPY Daily Price Chart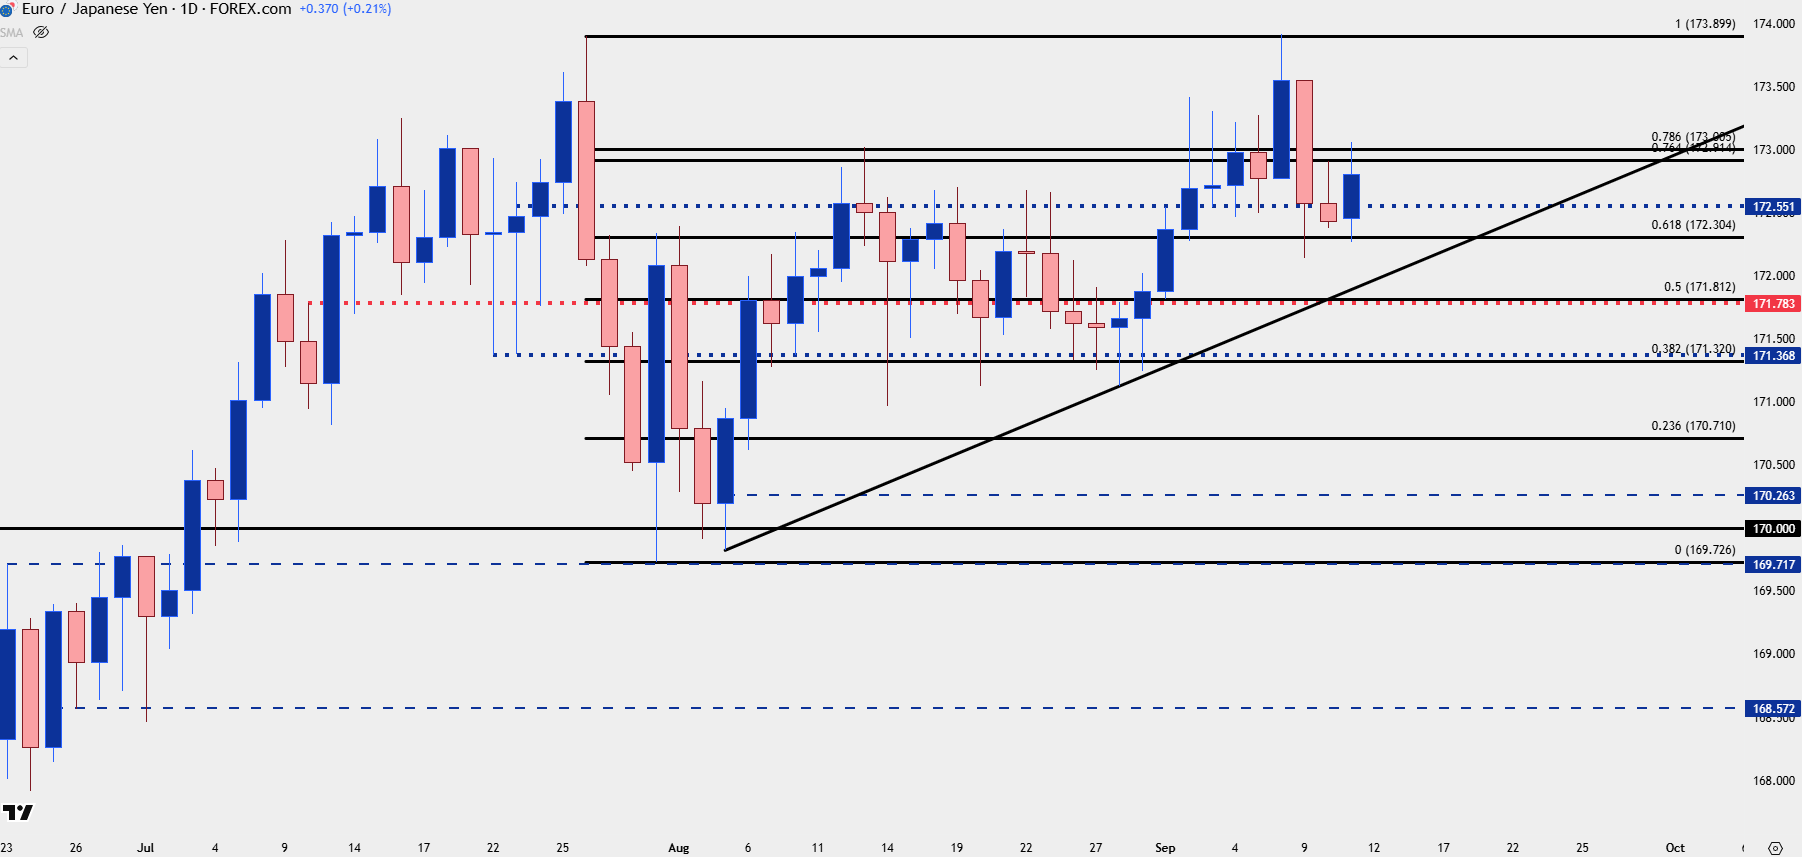
Chart prepared by James Stanley; data derived from Tradingview
GBP/JPY
GBP/JPY has been unable to leave the 200.00 level behind, and that saga remains, as of this writing, with the pair trading about 12 pips below the big figure. But, as covered in the Monday article and video, it’s been showing more comfort above that price which illustrates the fact that bulls appear to be gaining acceptance above that level. Monday amounted to a fresh high, albeit barely; but the rorresponding pullback from that has held a higher-low, and we saw another post yesterday and so far today. This would have similar tonality of an ascending triangle, such as what I looked at above in EUR/JPY, however the GBP/JPY setup would be shorter-term in nature given that we’ve seen so much rapid activity around the 200-handle and that’s a price that’s been in the equation now for almost two months, after bulls recoiled away in July ahead of an almost 500-pip retracement.
As I’ve been saying in webinar, I still think that GBP is more attractive than Euro for USD-weakness strategies, although that may change if we see Euro bulls able to drive on the back of Lagarde’s comment earlier this morning. But, that dynamic shows against the Yen, as well, illustrated by the frequency of resistance tests at the 200-level.
GBP/JPY Daily Price Chart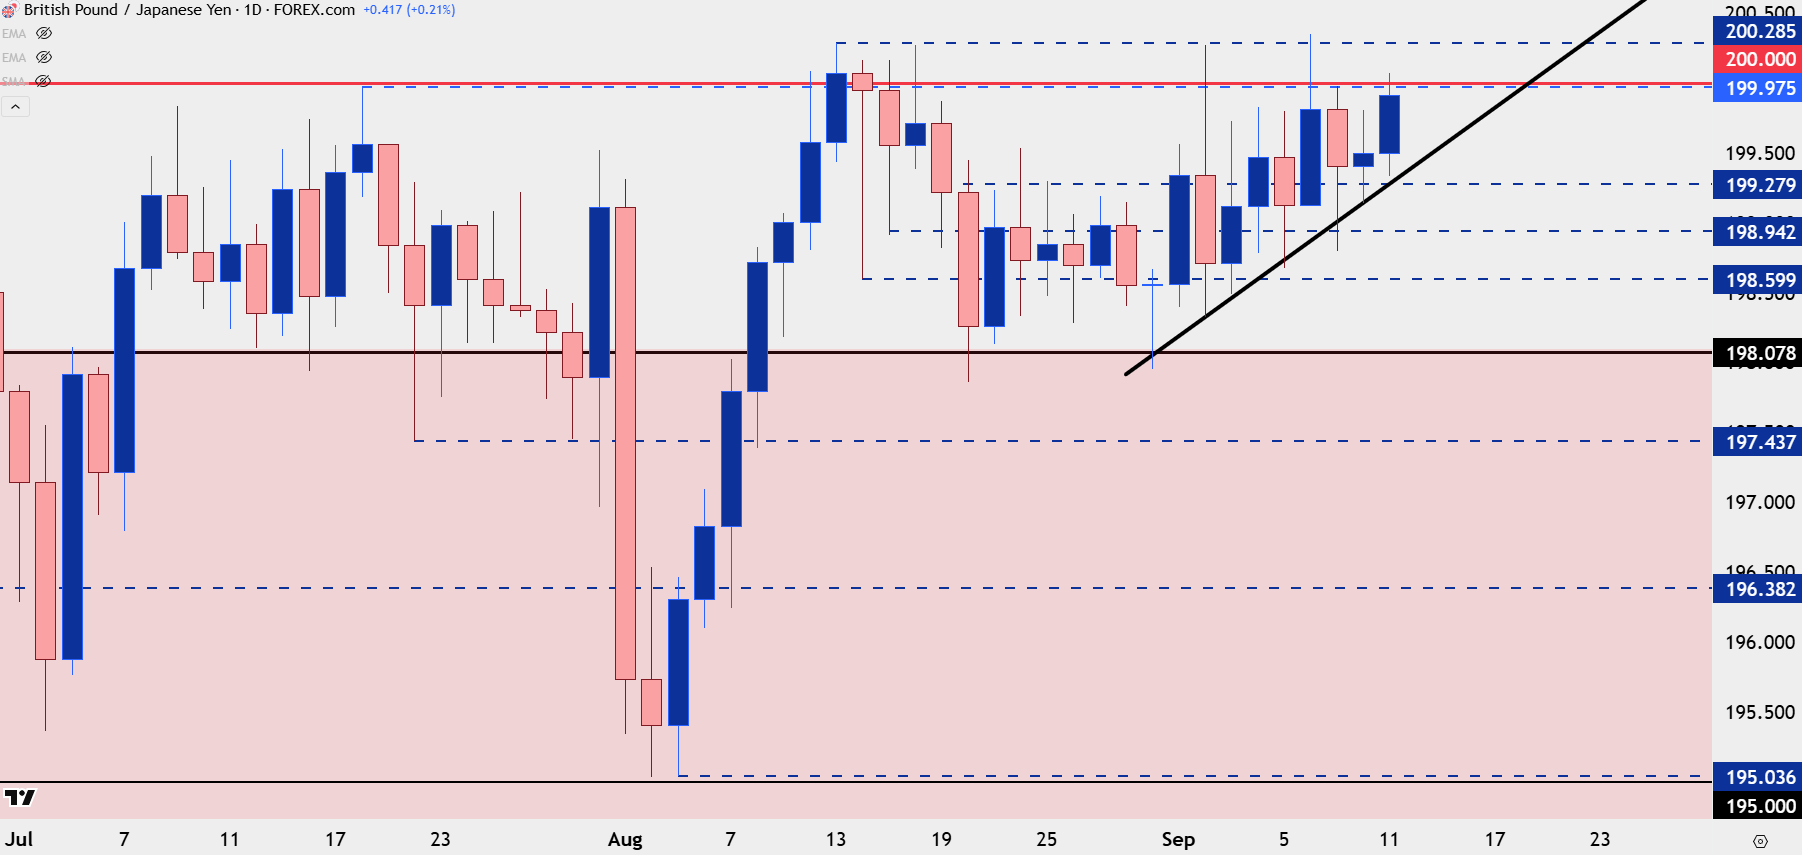
Chart prepared by James Stanley; data derived from Tradingview
--- written by James Stanley, Senior Strategist
Latest market news




The complete CFD trading experience
Award-winning platforms, competitive spreads, low commissions and dedicated support.
We live and breathe the markets and are dedicated to helping traders realise their ambitions as we continue to set the industry bar.
Economic calendar
Web Trader platform
Our sophisticated web-based platform is packed with features.
Related articles
Bitcoin Tests Support as Gold Rally Falls Flat, Falls to FOMC Lows
Surging yields and higher rate hike odds present a new wrinkle for markets, and this has softened the trend in gold. Bitcoin, meanwhile, has retained strong bullish structure and continues to show a brighter backdrop than XAU/USD.
Japanese Yen Forecast: USD/JPY 4% Rally Challenges Post-Intervention Downtrend 9 24 2026
USD/JPY momentum has shifted sharply higher, putting a major resistance confluence in focus as U.S. and Japanese event risk builds.


Oil, USD/JPY Forecast: Two trades to watch
Oil recovers above $90 amid a lack of progress in US-Iran diplomacy. USD/JPY rises to 158 on widening Fed-BoJ policy outlook.

StoneX Europe Ltd may make third party material available on this website which may contain information included but not limited to the conditions of financial markets. The material is for information purposes only and does not contain, and should not be construed as containing, investment advice and/or investment recommendation and/or an investment research and/or an offer of or solicitation for any transactions in financial instruments; any decision to enter into a specific transaction shall be made by the client following an assessment by him/her of their situation.
StoneX Europe Ltd makes no representation or warranty and assumes no liability as to the accuracy or completeness of the information provided, nor any loss arising from any investment based on a recommendation, forecast or other information supplied. You should always seek independent advice as to your suitability to speculate in any related markets and your ability to assume the associated risks, if you are at all unsure. We are not under any obligation to update any such material. Any opinion made may be personal to the author and may not reflect the opinion of StoneX Europe Ltd.