
U.S. Dollar Talking Points:
- The US Dollar is higher on the day despite a massive revision to jobs data over the past year. This deduction may be highlighting something important for traders.
- While fundamentals can often push prices and while technical can usually offer context for where prices have went, it’s sentiment and positioning that often carry the largest bearing on where prices will go. And those deductive items can take on more and more importance given that context.
- This is an archived webinar and you’re welcome to join the next. Click here to register.
It’s been a contentious past month for the US Dollar, and the weekly chart below illustrates this well. While the headlines have had a decisively bearish tone for the USD and while several rate cuts have been priced-in to the end of next year, the Dollar still has refused to breakdown, instead holding above the higher-low support from the month of July.
This isn’t to say that bulls have had their way as there’s also been a series of upper wicks indicating just how aggressive sellers have swatted the move back down going back to August 1st, on the heels of the Non-farm Payrolls release.
US Dollar Weekly Chart
Chart prepared by James Stanley; data derived from Tradingview
The USD daily chart has been considerably choppier especially over the past few weeks, with this morning showing yet another short-term low with sellers unable to continue the drive. This happened on the back of the payrolls revisions that I spoke of in the above video, and it places more emphasis on the CPI report set for release on Thursday morning.
From the below chart, however, some important deductions can be made in major pairs, such as the bullish structure in USD/CAD or the higher-lows in USD/JPY since late-April, with the July 1st inflection in the pair contrasting nicely with the fresh three-year low in DXY.
U.S. Dollar Daily Chart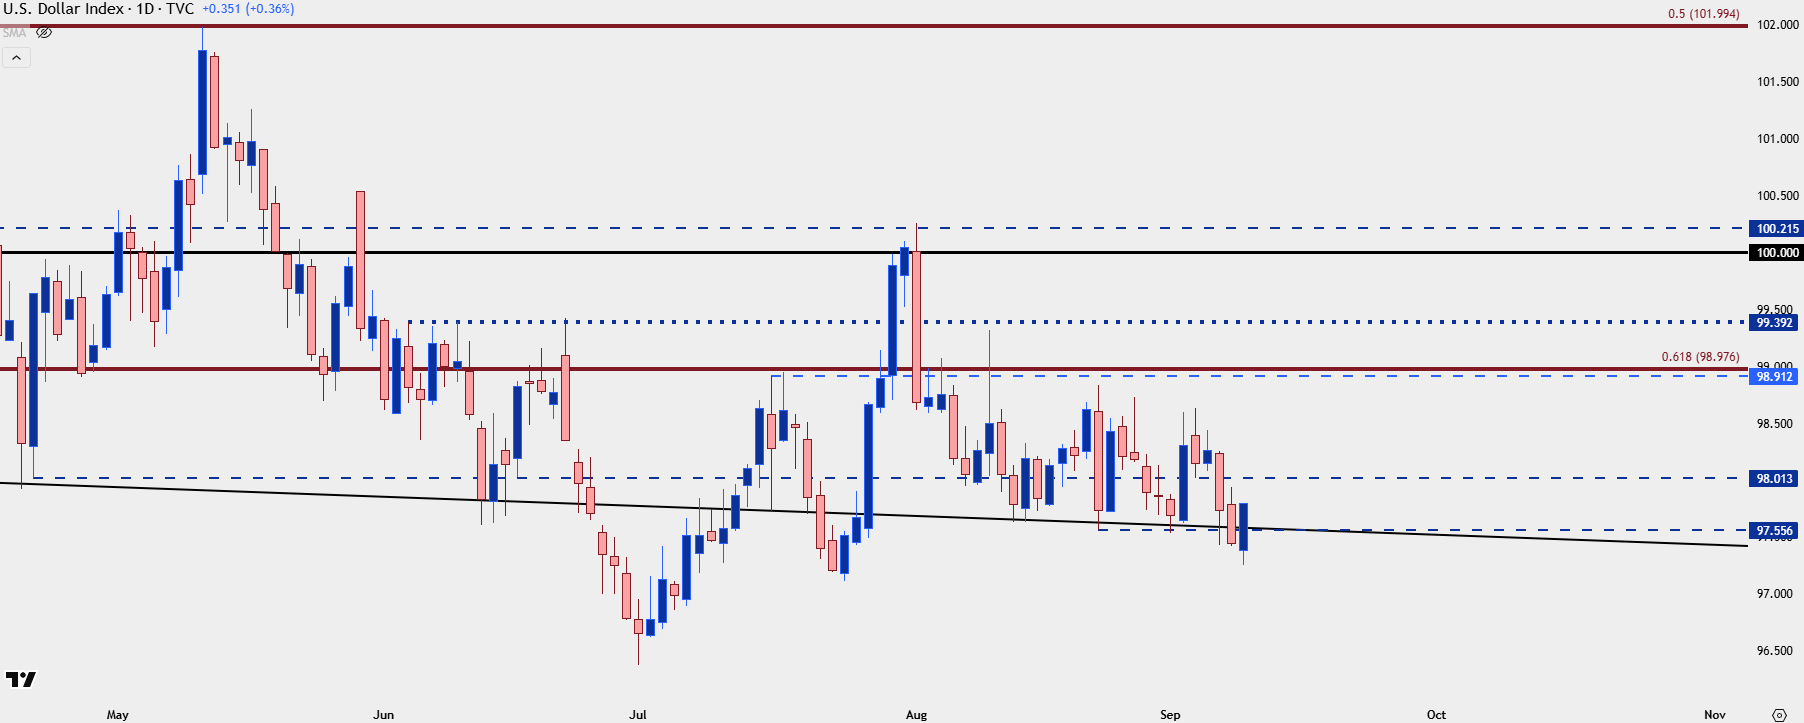
Chart prepared by James Stanley; data derived from Tradingview

EUR/USD
While the USD shows tendencies of a beleaguered bearish trend, EUR/USD retains a mirror image. At this point, bulls still have a chance as the Friday NFP report and yesterday’s price action showed a breakout at a big spot on the chart. But – so far today that’s showing pullback and price is already at the first support level looked at in yesterday’s article.
Perhaps more interesting is the next support zone down, from 1.1675-1.1686. And as looked at in the webinar, the 1.1613 swing sets up an area for possible bullish invalidation.
EUR/USD Daily Chart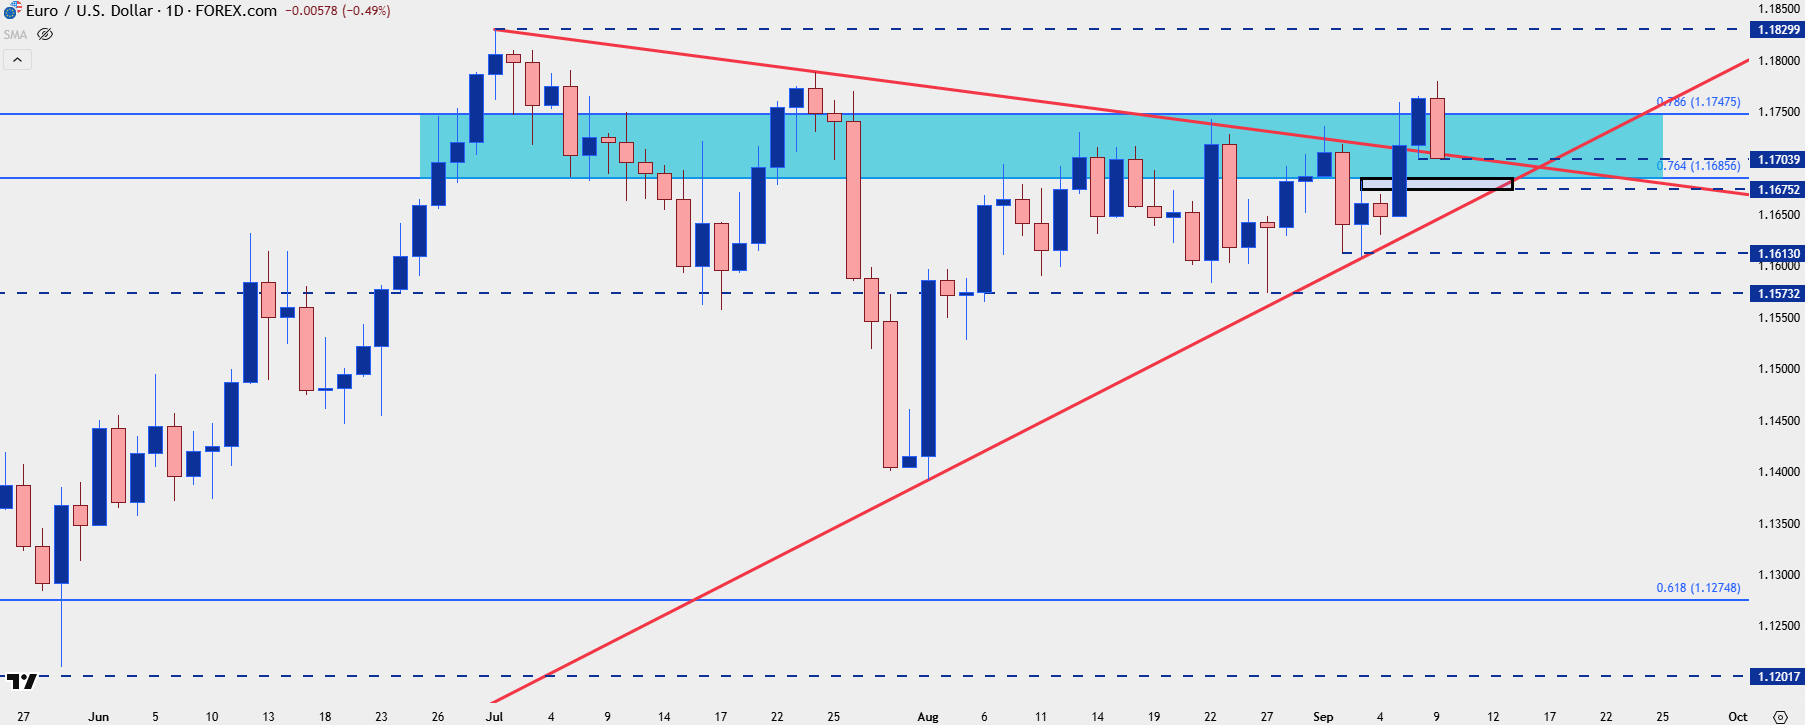
Chart prepared by James Stanley; data derived from Tradingview
GBP/USD
For USD-weakness I continue to track the shorter-term bullish trend in GBP/USD. I had looked at the pair in last week’s webinar and at the time, I wanted to see a daily close above the Fibonacci level of 1.3389. That happened on Tuesday and again on Wednesday, after which a short-term bullish trend took over until the pullback from 1.3590. At this point, there’s now support potential around the 1.3500 handle, up to the 1.3511 prior swing.
GBP/USD Four-Hour Chart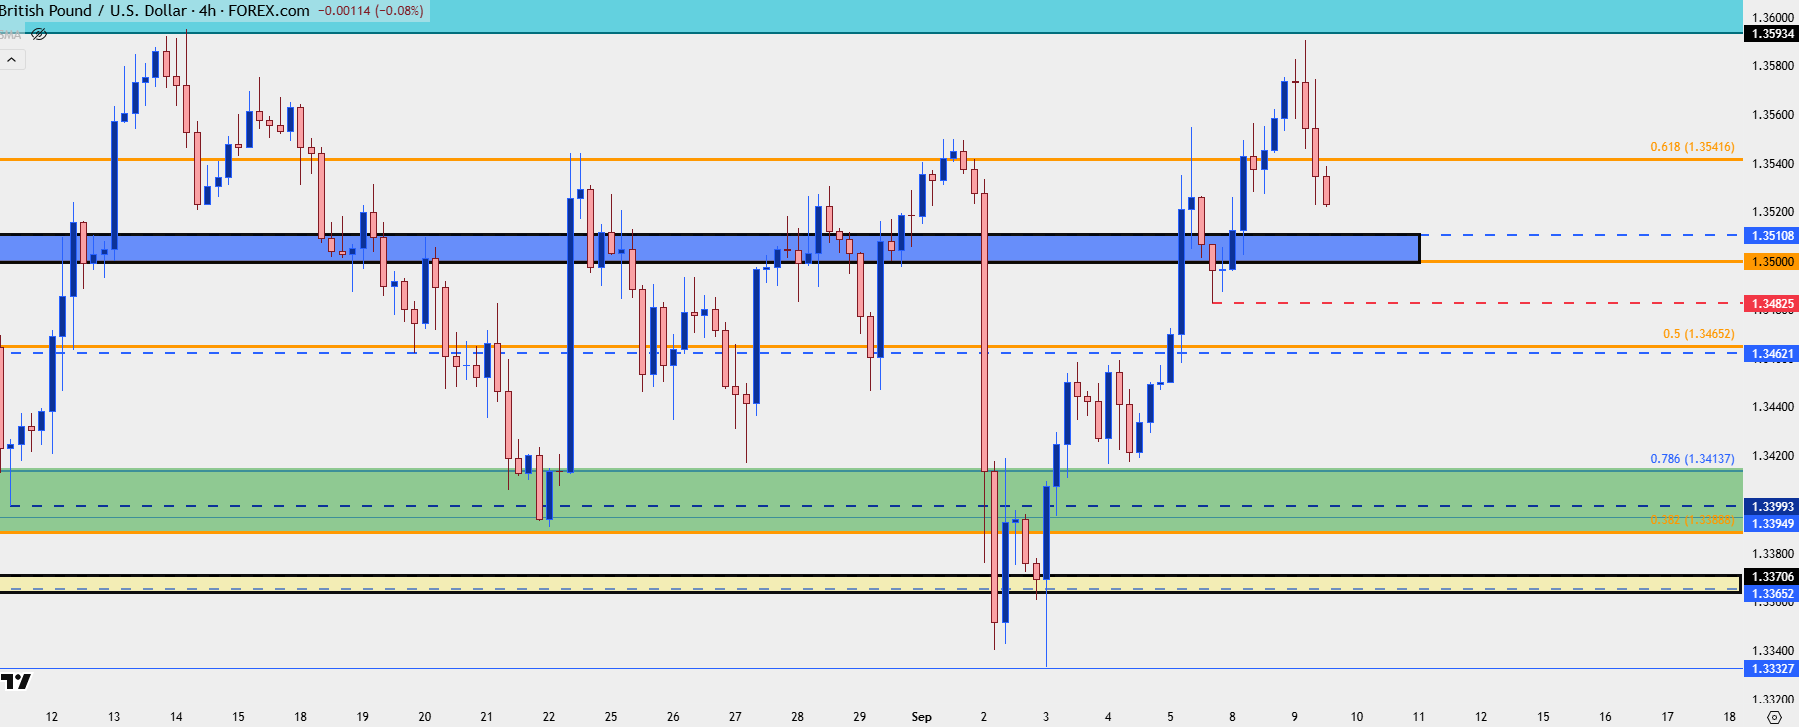
Chart prepared by James Stanley; data derived from Tradingview
USD/CAD
For USD-strength, USD/CAD remains attractive. And as a case in point, despite the USD’s short-term lower-low this morning or even the three-year low on day one of Q3, USD/CAD has held higher-lows over both instances. And from the daily and even weekly chart, there remains an argument for bullish structure.
On Friday, around both NFP and Canadian jobs data, we saw buyers come in to hold the low above the 1.3750 zone which illustrates yet another higher-low. I’m tracking next resistance at the familiar zone around 1.3900 followed by the 1.4000 psychological level.
USD/CAD Daily Chart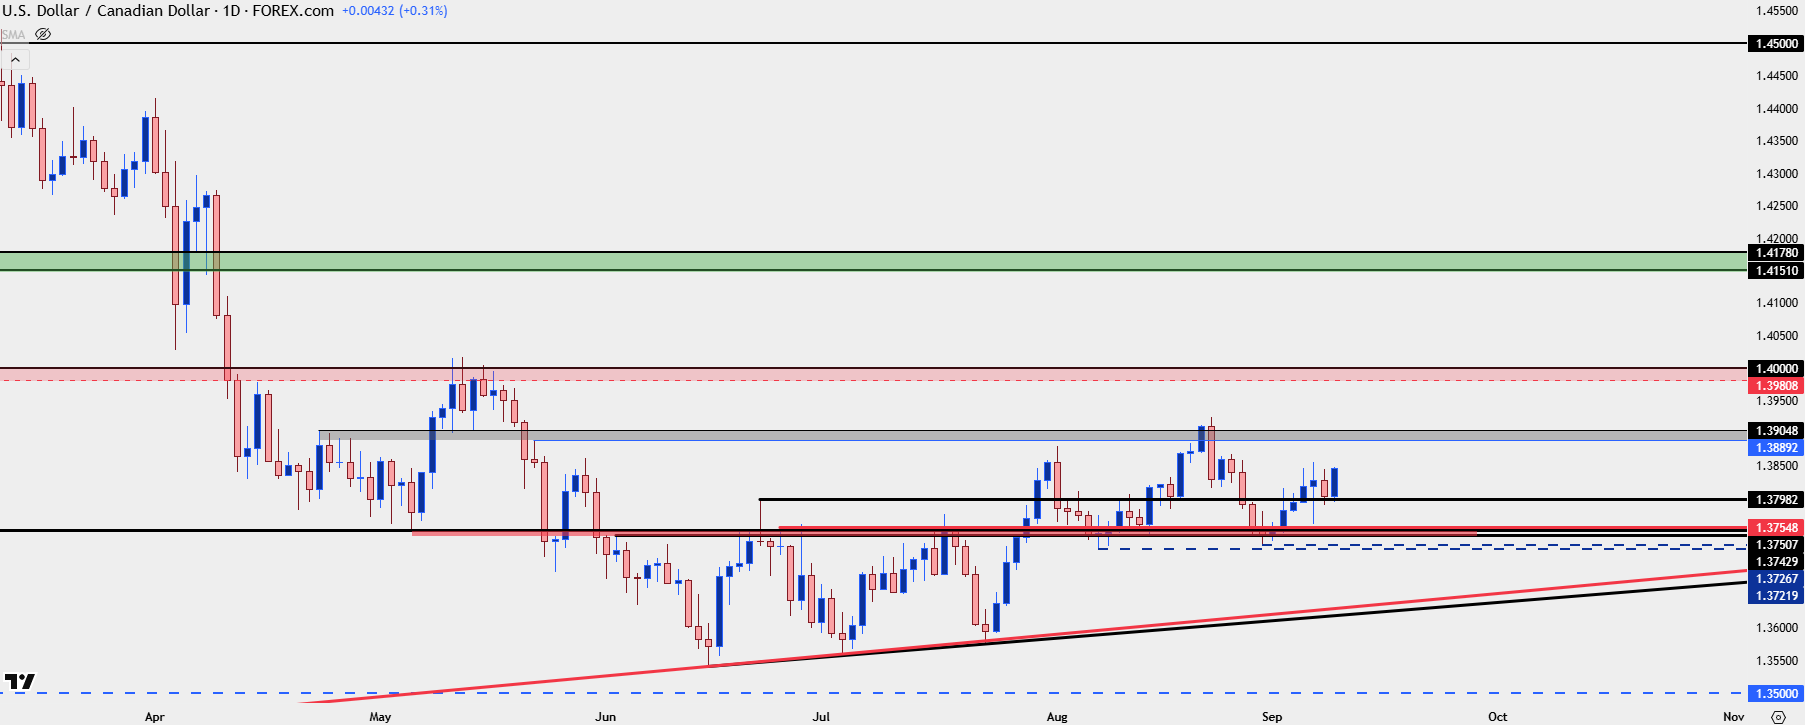
Chart prepared by James Stanley; data derived from Tradingview
USD/JPY
While it’s been a meandering quarter so far for the USD, it’s been a rather consistent range in USD/JPY of late and this is a pair that may have more longer-term repercussion for macro markets given the carry trade.
CPI prints have shown a tendency to swing the USD/JPY pair , such as what showed in April or again in May with strong bearish moves in the pair on the back of below expected headline CPI releases. I’ve marked the past few CPI releases on the below chart with vertical lines.
Notably, that divergence mentioned earlier has been particularly noticeable here as range support has held since the Monday after NFP, even with USD continuing to grind-lower. This highlights the addition of Yen-weakness, and as looked at in yesterday’s article, there may be more amenable pastures for that elsewhere, such as EUR/JPY and/or GBP/JPY.
USD/JPY Daily Chart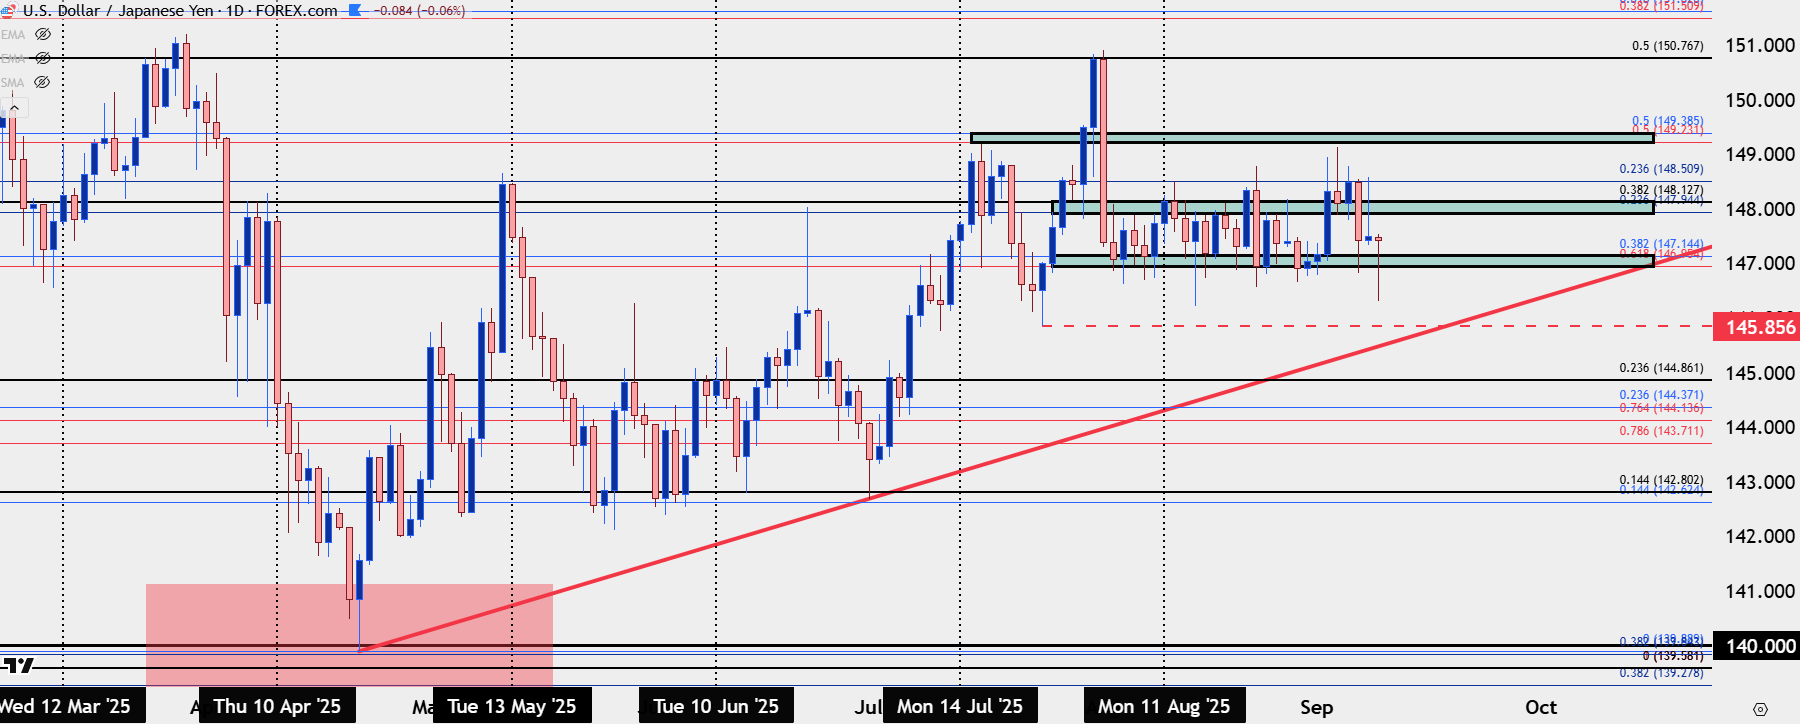
Chart prepared by James Stanley; data derived from Tradingview
--- written by James Stanley, Senior Strategist