





USDCAD Technical outlook Is it time for a longterm change in trend
A weaker price on a in crude oil on the weekly chart would suggest a stronger USD/CAD on the longer-term timeframe!
Share this:

As with any currency pair, there are an abundance of factors to consider when trying to forecast price. Those factors can be broken down into technical factors and fundamental factors. On the technical side, price action is paramount. However, for USD/CAD, one must also include the correlation between USD/CAD and crude oil when considering price movement. Crude oil is a key export for the Canadian economy; therefore, it is important that we also consider the price movement of USD/CAD.
USD/CAD
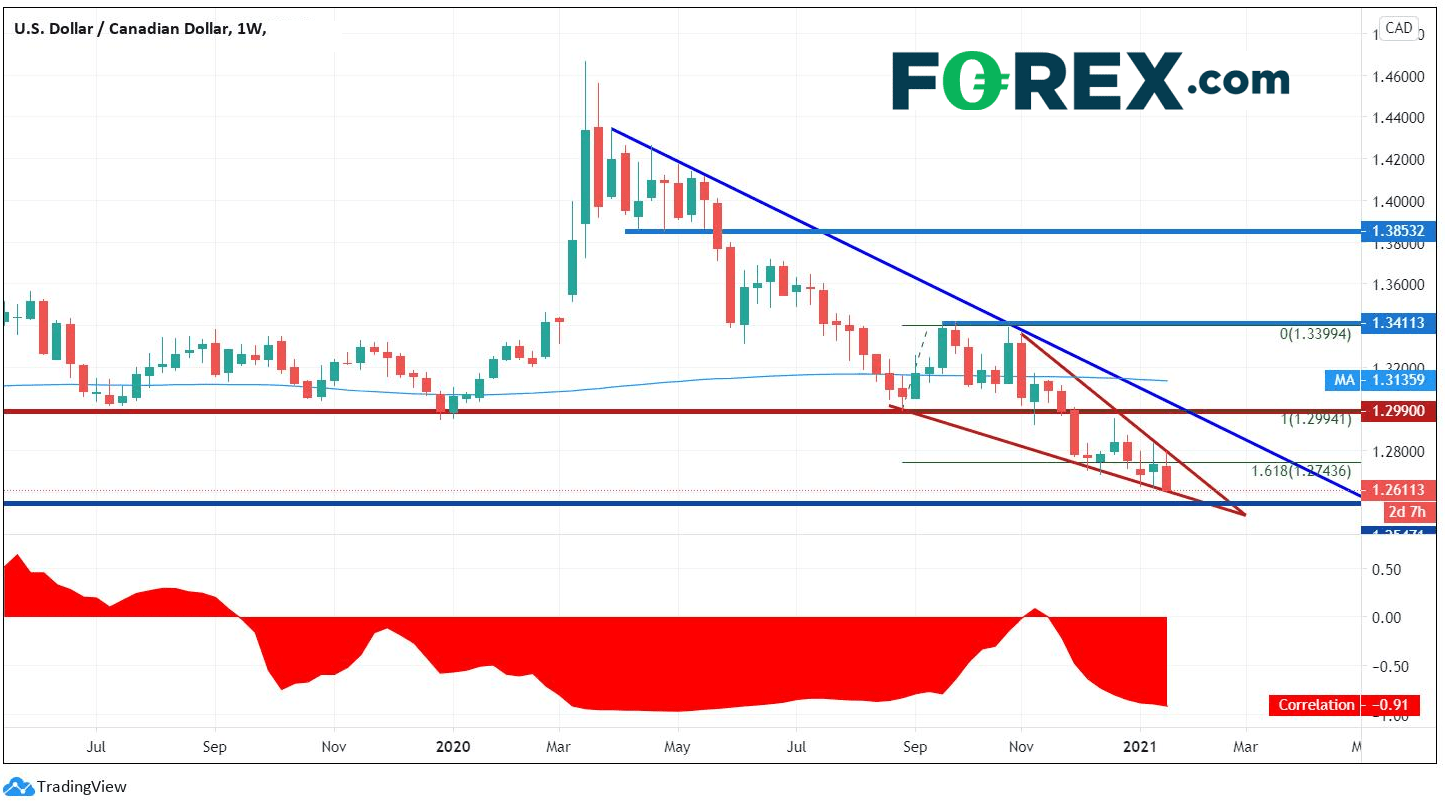
On a weekly timeframe, USD/CAD has been moving lower since its pandemic highs at 1.4667 in March 2020. The downtrend is still intact; however, the pair may be ready for a bounce. Since late September 2020, USD/CAD has been forming a descending wedge, and is currently nearing the apex. A descending wedge would suggest a breakout to the topside, with the target being a complete 100% retracement of the wedge, near 1.3410. In addition, price is hovering around the support area of the 161.8% Fibonacci extension from the lows during the week of August 31st to the highs during the week of September 21st.
Source: Tradingview, City Index
The trend is still lower, however if USD/CAD breaks higher out of the descending wedge, there will be strong resistance on its way back to target. A downward sloping trendline and horizontal resistance converge near 1.2990 and the 200 Week moving average crosses at 1.3136. Major support isn’t until 1.2061, however this is horizontal support below near 1.2547.
Also notice the correlation coefficient at the bottom of the chart. Dating back to late 2018, most of the time crude oil and USD/CAD have had a negative correlation, meaning the 2 assets have been moving in opposite directions. (This means that the Canadian Dollar and Crude Oil prices have been moving in the same direction.) The current correlation coefficient is -0.91. For reference, a correlation coefficient of -1.00 means that the 2 assets are perfectly correlated and move in opposite directions on a one to one basis 100% of the time. The current correlation coefficient of -0.91 indicates a strong negative correlation!
WTI
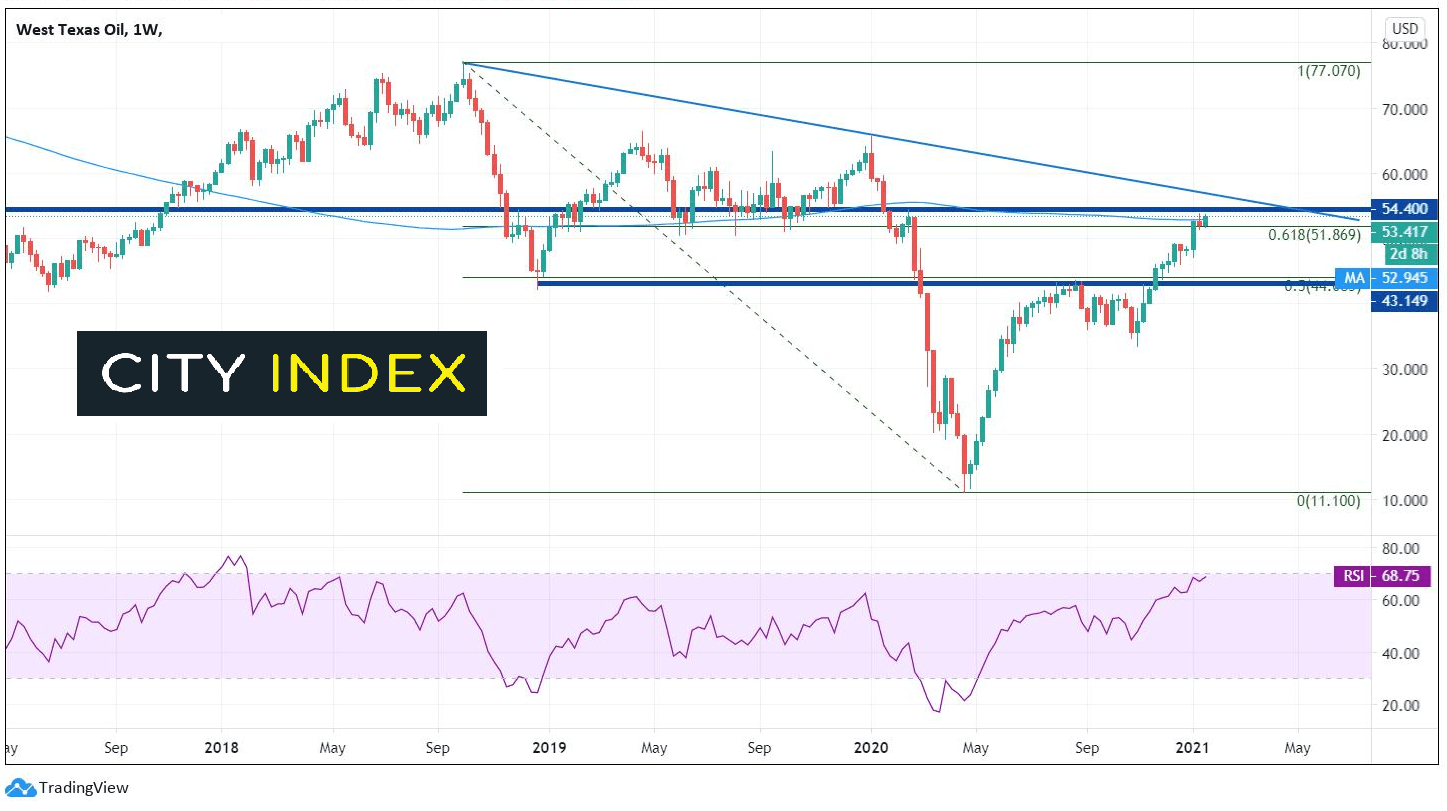
As mentioned, its important to look at crude oil when discussing the Canadian Dollar. West Texas Oil (WTI) is right in the middle of a strong resistance zone between 50.50 and 54.40. This area has acted an important “decision zone” for traders dating back to 2014. In addition, the 61.8% Fibonacci retracement from the week of October 2018 highs to the March 2020 lows crosses just below at 51.86. The 200-week moving average also crosses in this zone near 52.96. Just above, there is a downward sloping trendline from the October 2018 highs, which crosses near 57.00. And although the RSI is not in overbought conditions yet, its pretty close at 68.81.
Source: Tradingview, City Index
Given the strong correlation between WTI and USD/CAD, IF this resistance zone can hold and WTI pulls back towards horizontal support at 47.20, then it could mean a weaker Canadian Dollar as well. Therefore, a weaker price on a weekly chart in crude oil would suggest a stronger USD/CAD on the longer-term timeframe!
For a technical insight on USD/JPY, click here
Learn more about forex trading opportunities.
As with any currency pair, there are an abundance of factors to consider when trying to forecast price. Those factors can be broken down into technical factors and fundamental factors. On the technical side, price action is paramount. However, for USD/CAD, one must also include the correlation between USD/CAD and crude oil when considering price movement. Crude oil is a key export for the Canadian economy; therefore, it is important that we also consider the price movement of USD/CAD.
USD/CAD
On a weekly timeframe, USD/CAD has been moving lower since its pandemic highs at 1.4667 in March 2020. The downtrend is still intact; however, the pair may be ready for a bounce. Since late September 2020, USD/CAD has been forming a descending wedge, and is currently nearing the apex. A descending wedge would suggest a breakout to the topside, with the target being a complete 100% retracement of the wedge, near 1.3410. In addition, price is hovering around the support area of the 161.8% Fibonacci extension from the lows during the week of August 31st to the highs during the week of September 21st.
Source: Tradingview, FOREX.com
The trend is still lower, however if USD/CAD breaks higher out of the descending wedge, there will be strong resistance on its way back to target. A downward sloping trendline and horizontal resistance converge near 1.2990 and the 200 Week moving average crosses at 1.3136. Major support isn’t until 1.2061, however this is horizontal support below near 1.2547.
Also notice the correlation coefficient at the bottom of the chart. Dating back to late 2018, most of the time crude oil and USD/CAD have had a negative correlation, meaning the 2 assets have been moving in opposite directions. (This means that the Canadian Dollar and Crude Oil prices have been moving in the same direction.) The current correlation coefficient is -0.91. For reference, a correlation coefficient of -1.00 means that the 2 assets are perfectly correlated and move in opposite directions on a one to one basis 100% of the time. The current correlation coefficient of -0.91 indicates a strong negative correlation!
WTI
As mentioned, its important to look at crude oil when discussing the Canadian Dollar. West Texas Oil (WTI) is right in the middle of a strong resistance zone between 50.50 and 54.40. This area has acted an important “decision zone” for traders dating back to 2014. In addition, the 61.8% Fibonacci retracement from the week of October 2018 highs to the March 2020 lows crosses just below at 51.86. The 200-week moving average also crosses in this zone near 52.96. Just above, there is a downward sloping trendline from the October 2018 highs, which crosses near 57.00. And although the RSI is not in overbought conditions yet, its pretty close at 68.81.
Source: Tradingview, FOREX.com
Given the strong correlation between WTI and USD/CAD, IF this resistance zone can hold and WTI pulls back towards horizontal support at 47.20, then it could mean a weaker Canadian Dollar as well. Therefore, a weaker price on a weekly chart in crude oil would suggest a stronger USD/CAD on the longer-term timeframe!
For a technical insight on USD/JPY, click here
Learn more about forex trading opportunities.
Latest market news




The complete CFD trading experience
Award-winning platforms, competitive spreads, low commissions and dedicated support.
We live and breathe the markets and are dedicated to helping traders realise their ambitions as we continue to set the industry bar.
Economic calendar
Web Trader platform
Our sophisticated web-based platform is packed with features.
Related articles
EUR/USD Q4 2026 Outlook: Euro at a Crossroads as Fed, ECB Tighten 9 25 2026
EUR/USD enters Q4 at a pivotal inflection point as competing Fed-ECB policy paths and persistent inflation risks collide with major technical support.
USD/JPY Q4 2026 Outlook: Hawkish Fed Pricing Clashes With Intervention Risk
The year-end tug-of-war is clear: hawkish Fed pricing supports USD/JPY, while intervention risk limits the upside.

USD/CAD and USD/MXN Q4 2026 Outlook: Will the U.S. Dollar Dominate North America Again?
The final stretch of 2026 is approaching, and North America's major currencies have begun to show a shift in the strength dynamics seen earlier in the year. New expectations of a more aggressive monetary policy stance, particularly in the United States, could be significantly reshaping the outlook for the region. At the same time, this backdrop, combined with potential trade tensions across North America, may become one of the most important drivers of currency performance in the months ahead.

StoneX Europe Ltd may make third party material available on this website which may contain information included but not limited to the conditions of financial markets. The material is for information purposes only and does not contain, and should not be construed as containing, investment advice and/or investment recommendation and/or an investment research and/or an offer of or solicitation for any transactions in financial instruments; any decision to enter into a specific transaction shall be made by the client following an assessment by him/her of their situation.
StoneX Europe Ltd makes no representation or warranty and assumes no liability as to the accuracy or completeness of the information provided, nor any loss arising from any investment based on a recommendation, forecast or other information supplied. You should always seek independent advice as to your suitability to speculate in any related markets and your ability to assume the associated risks, if you are at all unsure. We are not under any obligation to update any such material. Any opinion made may be personal to the author and may not reflect the opinion of StoneX Europe Ltd.