





USDJPY near strong support DXY may be the key for next move
Given the current USD/JPY – DXY correlation coefficient, DXY may give a clue as to where USD/JPY may be headed.
Share this:

On a daily timeframe, USD/JPY and the US Dollar Index (DXY) have been highly correlated since late December 2020 (see bottom of chart below). The current correlation coefficient is +0.86. For comparison, a correlation coefficient of +1.00 means that USD/JPY and they DXY are perfectly correlated and move together 100% of the time.
USD/JPY reached its flag target near 105.00 last week, which was also the 161.8% Fibonacci extension from the highs of January 11th to the lows of January 21st. After briefly moving above that level, price action on Friday and yesterday left large wicks on the tops of their daily candlesticks, indicating sellers were in the market and a move lower could be ahead. The daily RSI was also in overbought territory. The DXY has been moving lower over the last few days, and as a result of the high correlation, it’s no surprise that USD/JPY has been pulling back as well. But the pair is closing in on strong support near 104.45. This level was horizontal resistance on the way up, as well as, the breakout level above the upper downward sloping trendline of the descending wedge.
Source: Tradingview, City Index
Everything you should know about the Japanese Yen (JPY)
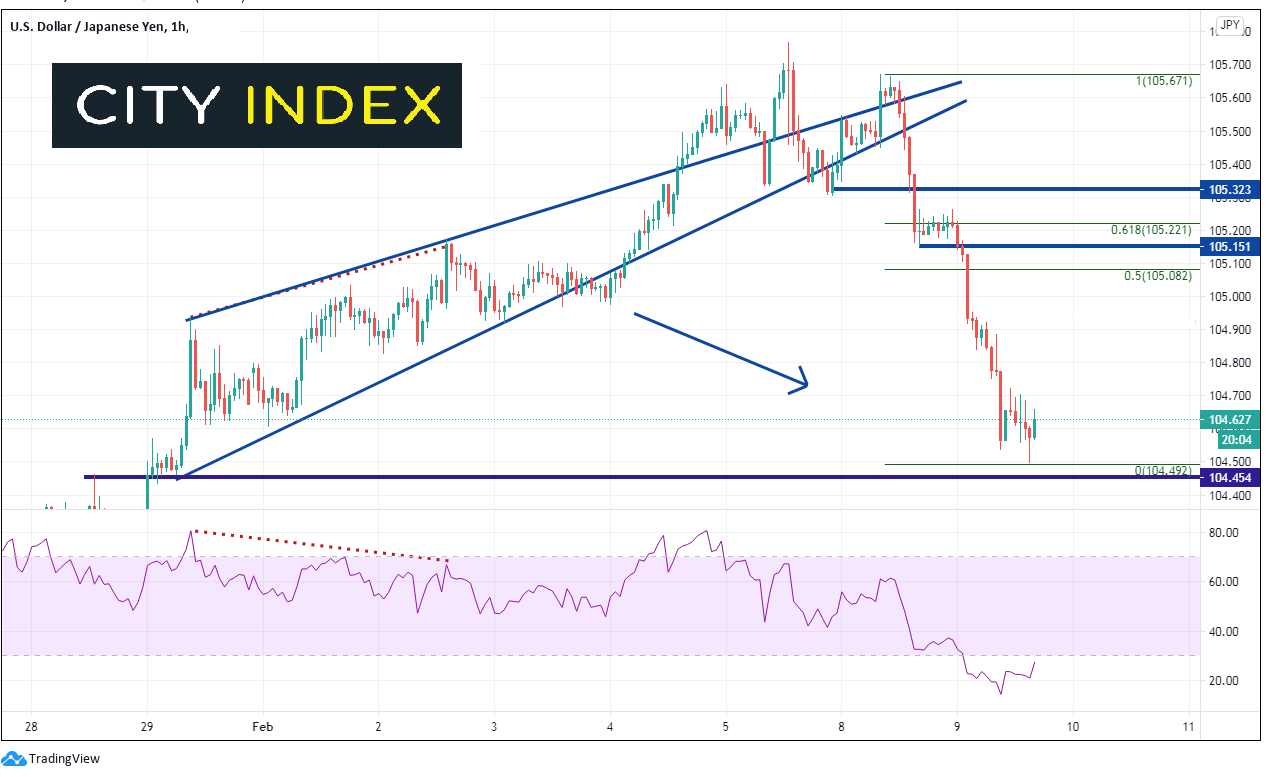
On a short-term 60 minute timeframe, there was a false breakout above an ascending wedge which we highlighted last week. Price eventually rolled over and fell from a high on Friday of 105.76 down to todays current lows near 104.50. Notice that USD/JPY has held the 104.45 level thus far. The intraday RSI is also in oversold territory and in turning higher. Intraday resistance above is near 105.15, which also confluences near the 50% retracement level and the 61.8% Fibonacci retracement level from yesterday’s highs to today’s lows. Next horizontal resistance is 105.32 before the recent highs at 105.76. Strong support is at the 104.45 level, then near 104.00 (not shown).
Source: Tradingview, City Inbex
Given the current USD/JPY – DXY correlation coefficient, DXY may give a clue as to where USD/JPY may be headed. In addition, bulls will be protecting the 104.45 level in USD/JPY. Watch for stops from weak longs below.
Learn more about forex trading opportunities.
On a daily timeframe, USD/JPY and the US Dollar Index (DXY) have been highly correlated since late December 2020 (see bottom of chart below). The current correlation coefficient is +0.86. For comparison, a correlation coefficient of +1.00 means that USD/JPY and they DXY are perfectly correlated and move together 100% of the time.
USD/JPY reached its flag target near 105.00 last week, which was also the 161.8% Fibonacci extension from the highs of January 11th to the lows of January 21st. After briefly moving above that level, price action on Friday and yesterday left large wicks on the tops of their daily candlesticks, indicating sellers were in the market and a move lower could be ahead. The daily RSI was also in overbought territory. The DXY has been moving lower over the last few days, and as a result of the high correlation, it’s no surprise that USD/JPY has been pulling back as well. But the pair is closing in on strong support near 104.45. This level was horizontal resistance on the way up, as well as, the breakout level above the upper downward sloping trendline of the descending wedge.
Source: Tradingview, FOREX.com
Everything you should know about the Japanese Yen (JPY)
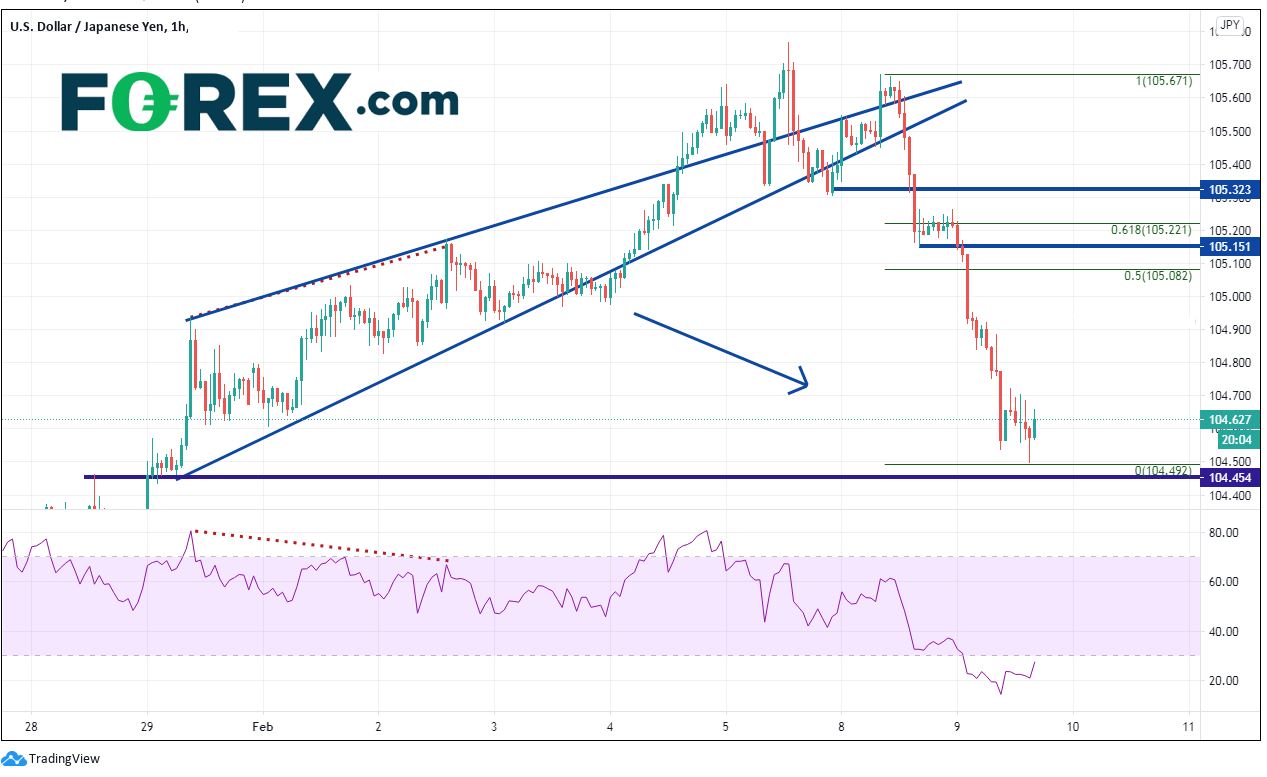
On a short-term 60 minute timeframe, there was a false breakout above an ascending wedge which we highlighted last week. Price eventually rolled over and fell from a high on Friday of 105.76 down to todays current lows near 104.50. Notice that USD/JPY has held the 104.45 level thus far. The intraday RSI is also in oversold territory and in turning higher. Intraday resistance above is near 105.15, which also confluences near the 50% retracement level and the 61.8% Fibonacci retracement level from yesterday’s highs to today’s lows. Next horizontal resistance is 105.32 before the recent highs at 105.76. Strong support is at the 104.45 level, then near 104.00 (not shown).
Source: Tradingview, FOREX.com
Given the current USD/JPY – DXY correlation coefficient, DXY may give a clue as to where USD/JPY may be headed. In addition, bulls will be protecting the 104.45 level in USD/JPY. Watch for stops from weak longs below.
Learn more about forex trading opportunities.



The complete CFD trading experience
Award-winning platforms, competitive spreads, low commissions and dedicated support.
We live and breathe the markets and are dedicated to helping traders realise their ambitions as we continue to set the industry bar.
Economic calendar
Web Trader platform
Our sophisticated web-based platform is packed with features.
Related articles

AUD/USD hammered by US yields and fading RBA hike bets
US yields, dollar strength and fading RBA hike bets have combined to drive AUD/USD to fresh multi-month lows. The macro and technical bias remains bearish, although history suggests parts of the move are now reaching unusually stretched levels.


EUR/USD Forecast: Euro Struggles to Find Support Even After U.S. PCE Data
The euro continues to face a challenging environment in the short term. The currency has struggled to regain ground against a U.S. dollar that remains firmly supported, a dynamic reflected in EUR/USD, which has now recorded three consecutive losing sessions and a decline of roughly 0.6%.


Canadian Dollar Forecast: USD/CAD Four-Week Rally Eyes Yearly Highs 9 30 2026
USD/CAD has advanced in 14 of the past 15 sessions, but stretched momentum raises the stakes as major resistance and NFP come into focus.

StoneX Europe Ltd may make third party material available on this website which may contain information included but not limited to the conditions of financial markets. The material is for information purposes only and does not contain, and should not be construed as containing, investment advice and/or investment recommendation and/or an investment research and/or an offer of or solicitation for any transactions in financial instruments; any decision to enter into a specific transaction shall be made by the client following an assessment by him/her of their situation.
StoneX Europe Ltd makes no representation or warranty and assumes no liability as to the accuracy or completeness of the information provided, nor any loss arising from any investment based on a recommendation, forecast or other information supplied. You should always seek independent advice as to your suitability to speculate in any related markets and your ability to assume the associated risks, if you are at all unsure. We are not under any obligation to update any such material. Any opinion made may be personal to the author and may not reflect the opinion of StoneX Europe Ltd.