




What to watch when UK banks report Q2 results
UK banks are due to report Q2 results. After the mixed signals from the US banks these results are keenly awaited to gain a deeper understanding of the coronavirus impact on the sector.
Share this:

UK banks are due to report Q2 results. After the mixed signals from the US banks these results are keenly awaited to gain a deeper understanding of the coronavirus impact on the sector.
The key factors which could drive the share price movement are:
1. Bad loan provisions
These represent the money that banks put aside in preparation for loans that they expect to be defaulted on or not paid back in full. Owing to coronavirus these provisions will be high. Businesses are folding and the number of people who have lost their job is increasing and will increase further as the government’s job retention scheme transitions towards employer’s contribution. The Q1 banks set aside a lot less than US banks suggesting there are less well prepared for a big hit. Analysts expect the total UK credit hit to be in the region of £19 billion in 22020 alone.
These represent the money that banks put aside in preparation for loans that they expect to be defaulted on or not paid back in full. Owing to coronavirus these provisions will be high. Businesses are folding and the number of people who have lost their job is increasing and will increase further as the government’s job retention scheme transitions towards employer’s contribution. The Q1 banks set aside a lot less than US banks suggesting there are less well prepared for a big hit. Analysts expect the total UK credit hit to be in the region of £19 billion in 22020 alone.
2. Net Interest Income
The BoE slashed interest rates to 300-year lows of 0.1% at t the start of the pandemic, whilst this could encourage more lending the NII will be squeezed, pressuring margins. This is particularly a problem for the domestic focused banks which have small investment banking and trading divisions
The BoE slashed interest rates to 300-year lows of 0.1% at t the start of the pandemic, whilst this could encourage more lending the NII will be squeezed, pressuring margins. This is particularly a problem for the domestic focused banks which have small investment banking and trading divisions
3. Trading Revenue
Some of these income headwinds could be offset by strong trading revenues. Similar to what we saw in the US banks earnings that those banks with larger trading divisions weathered the covid storm better thanks to record trading revenues.
Some of these income headwinds could be offset by strong trading revenues. Similar to what we saw in the US banks earnings that those banks with larger trading divisions weathered the covid storm better thanks to record trading revenues.
4. Brexit
The sector faces enormous uncertainty over Brexit, particularly as the EU has so far refused to commit to providing access to the bloc’s financial markets. Failure of the EU & UK to strike a deal could have consequences for the UK’s financial sector and the bank’s outlook.
The sector faces enormous uncertainty over Brexit, particularly as the EU has so far refused to commit to providing access to the bloc’s financial markets. Failure of the EU & UK to strike a deal could have consequences for the UK’s financial sector and the bank’s outlook.
Barclays – 29th July
Barclays set aside more in provisions for bad loans in Q1 than its peers, has a better loan to deposit ratio and has a larger investment trading arm. Barclays has rallied 60% since its mid-March lows, however the rally has run out of steam around the 120p level where it has traded around for the past month, supported by its 50-daily average. Whilst the stock also trades above its 100 sma it has fallen below its ascending trendline support and trades. A decisive move above 120p rising trendline and 122p resistance could indicate more buying is on the cards. A fall below 115p (50 sma) could open the door to further losses.

Barclays set aside more in provisions for bad loans in Q1 than its peers, has a better loan to deposit ratio and has a larger investment trading arm. Barclays has rallied 60% since its mid-March lows, however the rally has run out of steam around the 120p level where it has traded around for the past month, supported by its 50-daily average. Whilst the stock also trades above its 100 sma it has fallen below its ascending trendline support and trades. A decisive move above 120p rising trendline and 122p resistance could indicate more buying is on the cards. A fall below 115p (50 sma) could open the door to further losses.
Lloyds -30th July
The retail focused high street bank limited income diversification. This is problematic in a low rate environment after the BoE cut interest rates to historic lows, squeezing NII. Lloyds share price has not experienced any rebound to speak of, instead bumbling along the low levels reached at the height of lockdown. The stock trades below its 50, 100 and 200 daily moving averages indicating that the direction of least resistance is southwards. A move above resistance at 32p could negate the current negative bias, a move below 29p could see more bears jump in.

The retail focused high street bank limited income diversification. This is problematic in a low rate environment after the BoE cut interest rates to historic lows, squeezing NII. Lloyds share price has not experienced any rebound to speak of, instead bumbling along the low levels reached at the height of lockdown. The stock trades below its 50, 100 and 200 daily moving averages indicating that the direction of least resistance is southwards. A move above resistance at 32p could negate the current negative bias, a move below 29p could see more bears jump in.
NatWest (Formerly RBS) – July 31st
RBS changed its name to NatWest 22nd July with the new chart providing limited information. The stock has picked up around 20% from 100p low which has offered support through most of the crisis. Investors should look for a break above 125p could point to further gains whilst any sign of 115p not holding could see the door open back to 100p
RBS changed its name to NatWest 22nd July with the new chart providing limited information. The stock has picked up around 20% from 100p low which has offered support through most of the crisis. Investors should look for a break above 125p could point to further gains whilst any sign of 115p not holding could see the door open back to 100p
HSBC – 3rd August
HSBC has not only failed to hold its March lows but has declined further amid a combination of covid uncertainty and troubles over Hong Kong meaning investors are giving it a wide berth. The stock trades below its 50, 100 and 200 sma on a bearish chart. A rise above 390p could negate the current bearish trend although the path of least resistance is downwards.
UK banks are due to report Q2 results. After the mixed signals from the US banks these results are keenly awaited to gain a deeper understanding of the coronavirus impact on the sector.
The key factors which could drive the share price movement:
1. Bad loan provisions
These represent the money that banks put aside in preparation for loans that they expect to be defaulted on or not paid back in full. Owing to coronavirus these provisions will be high. Businesses are folding and the number of people who has lost jobs is increasing and will increase further as the government’s job retention scheme transitions towards employer’s contribution. The Q1 banks set aside a lot less than US banks suggesting there are less well prepared for a big hit. Analysts expect the total UK credit hit to be in the region of £19 billion in 22020 alone.
These represent the money that banks put aside in preparation for loans that they expect to be defaulted on or not paid back in full. Owing to coronavirus these provisions will be high. Businesses are folding and the number of people who has lost jobs is increasing and will increase further as the government’s job retention scheme transitions towards employer’s contribution. The Q1 banks set aside a lot less than US banks suggesting there are less well prepared for a big hit. Analysts expect the total UK credit hit to be in the region of £19 billion in 22020 alone.
2. Net Interest Income (NII)
The BoE slashed interest rates to a 300-year low of 0.1% at the start of the pandemic, whilst this could encourage more lending the NII will be squeezed, pressuring margins. This is particularly a problem for the domestic focused banks which have small investment banking and trading divisions, such as Lloyds and Natwest.
The BoE slashed interest rates to a 300-year low of 0.1% at the start of the pandemic, whilst this could encourage more lending the NII will be squeezed, pressuring margins. This is particularly a problem for the domestic focused banks which have small investment banking and trading divisions, such as Lloyds and Natwest.
3. Trading Revenue
Some of these income headwinds could be offset by strong trading revenues. Similar to what we saw in the US banks earnings that those banks with larger trading divisions weathered the covid storm better thanks to record trading revenues amid increased volatility in the markets.
Some of these income headwinds could be offset by strong trading revenues. Similar to what we saw in the US banks earnings that those banks with larger trading divisions weathered the covid storm better thanks to record trading revenues amid increased volatility in the markets.
4. Brexit
The sector faces enormous uncertainty over Brexit, particularly as the EU has so far refused to commit to providing access to the bloc’s financial markets. Failure of the EU & UK to strike a deal could have consequences for the UK’s financial sector and the bank’s outlook.
The sector faces enormous uncertainty over Brexit, particularly as the EU has so far refused to commit to providing access to the bloc’s financial markets. Failure of the EU & UK to strike a deal could have consequences for the UK’s financial sector and the bank’s outlook.
Barclays – 29th July
Barclays set aside more in provisions for bad loans in Q1 than its peers, has a better loan to deposit ratio and has a larger investment trading arm. Barclays has rallied 60% since its mid-March lows, however the rally has run out of steam around the 120p level where it has traded around for the past month, supported by its 50-daily average. Whilst the stock also trades above its 100 sma it has fallen below its ascending trendline support and trades. A decisive move above 120p rising trendline and 122p resistance could indicate more buying is on the cards. A fall below 115p (50 sma) could open the door to further losses.

Barclays set aside more in provisions for bad loans in Q1 than its peers, has a better loan to deposit ratio and has a larger investment trading arm. Barclays has rallied 60% since its mid-March lows, however the rally has run out of steam around the 120p level where it has traded around for the past month, supported by its 50-daily average. Whilst the stock also trades above its 100 sma it has fallen below its ascending trendline support and trades. A decisive move above 120p rising trendline and 122p resistance could indicate more buying is on the cards. A fall below 115p (50 sma) could open the door to further losses.
Lloyds -30th July
The retail focused high street bank limited income diversification. This is problematic in a low rate environment after the BoE cut interest rates to historic lows, squeezing NII. Lloyds share price has not experienced any rebound to speak of, instead bumbling along the low levels reached at the height of lockdown. The stock trades below its 50, 100 and 200 daily moving averages indicating that the direction of least resistance is southwards. A move above resistance at 32p could negate the current negative bias, a move below 29p could see more bears jump in.
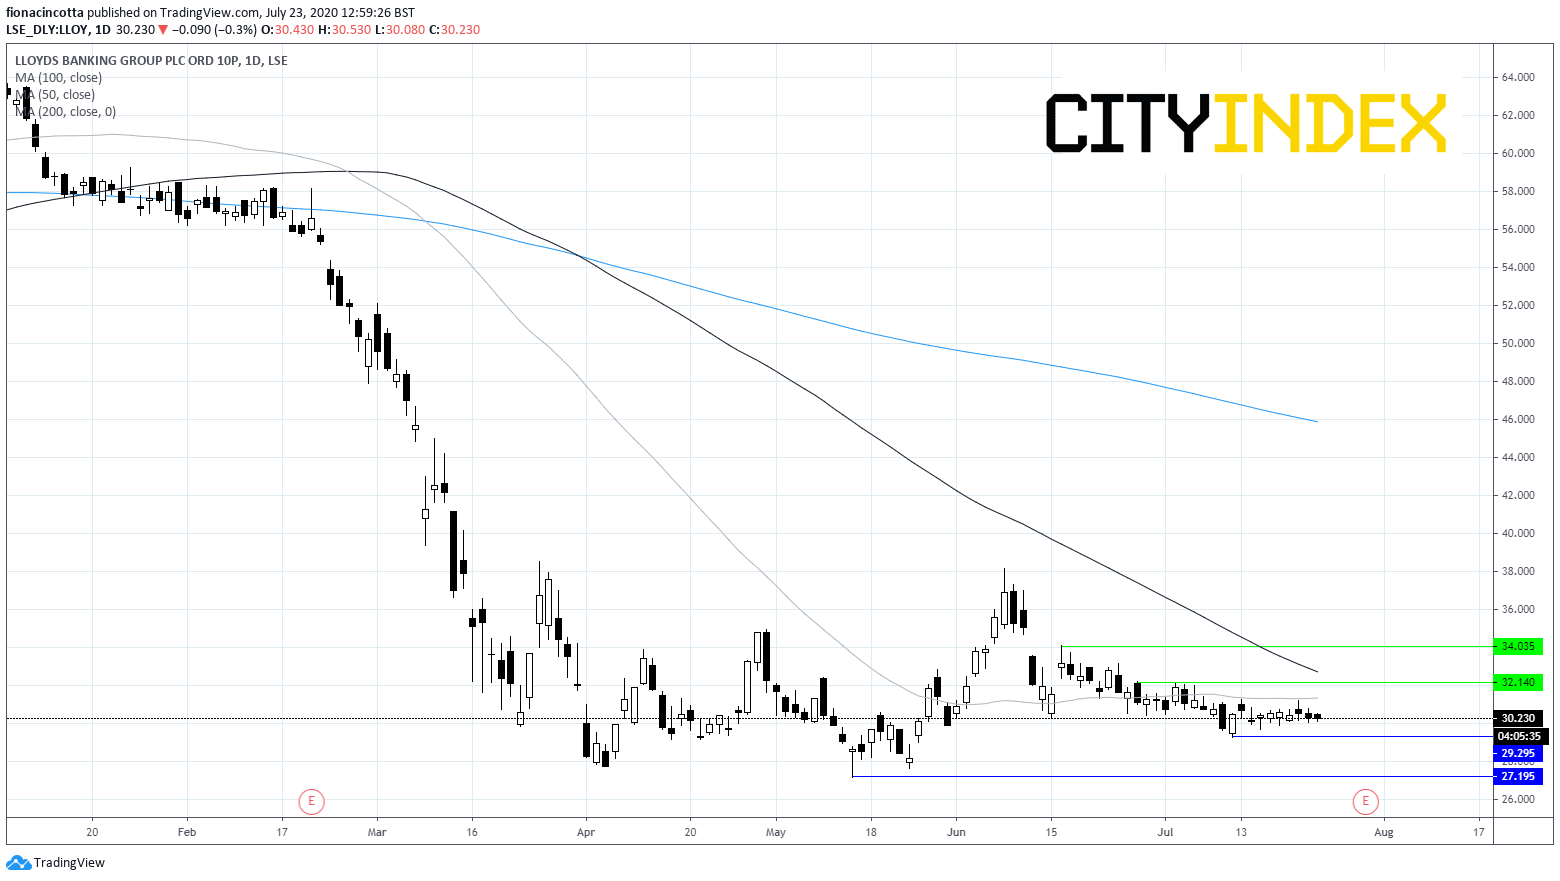
The retail focused high street bank limited income diversification. This is problematic in a low rate environment after the BoE cut interest rates to historic lows, squeezing NII. Lloyds share price has not experienced any rebound to speak of, instead bumbling along the low levels reached at the height of lockdown. The stock trades below its 50, 100 and 200 daily moving averages indicating that the direction of least resistance is southwards. A move above resistance at 32p could negate the current negative bias, a move below 29p could see more bears jump in.
NatWest (Formerly RBS) – July 31st
RBS changed its name to NatWest 22nd July with the new chart providing limited information. The stock has picked up around 20% from 100p low which has offered support through most of the crisis. Investors should look for a break above 125p could point to further gains whilst any sign of 115p not holding could see the door open back to 100p
RBS changed its name to NatWest 22nd July with the new chart providing limited information. The stock has picked up around 20% from 100p low which has offered support through most of the crisis. Investors should look for a break above 125p could point to further gains whilst any sign of 115p not holding could see the door open back to 100p
HSBC – 3rd August
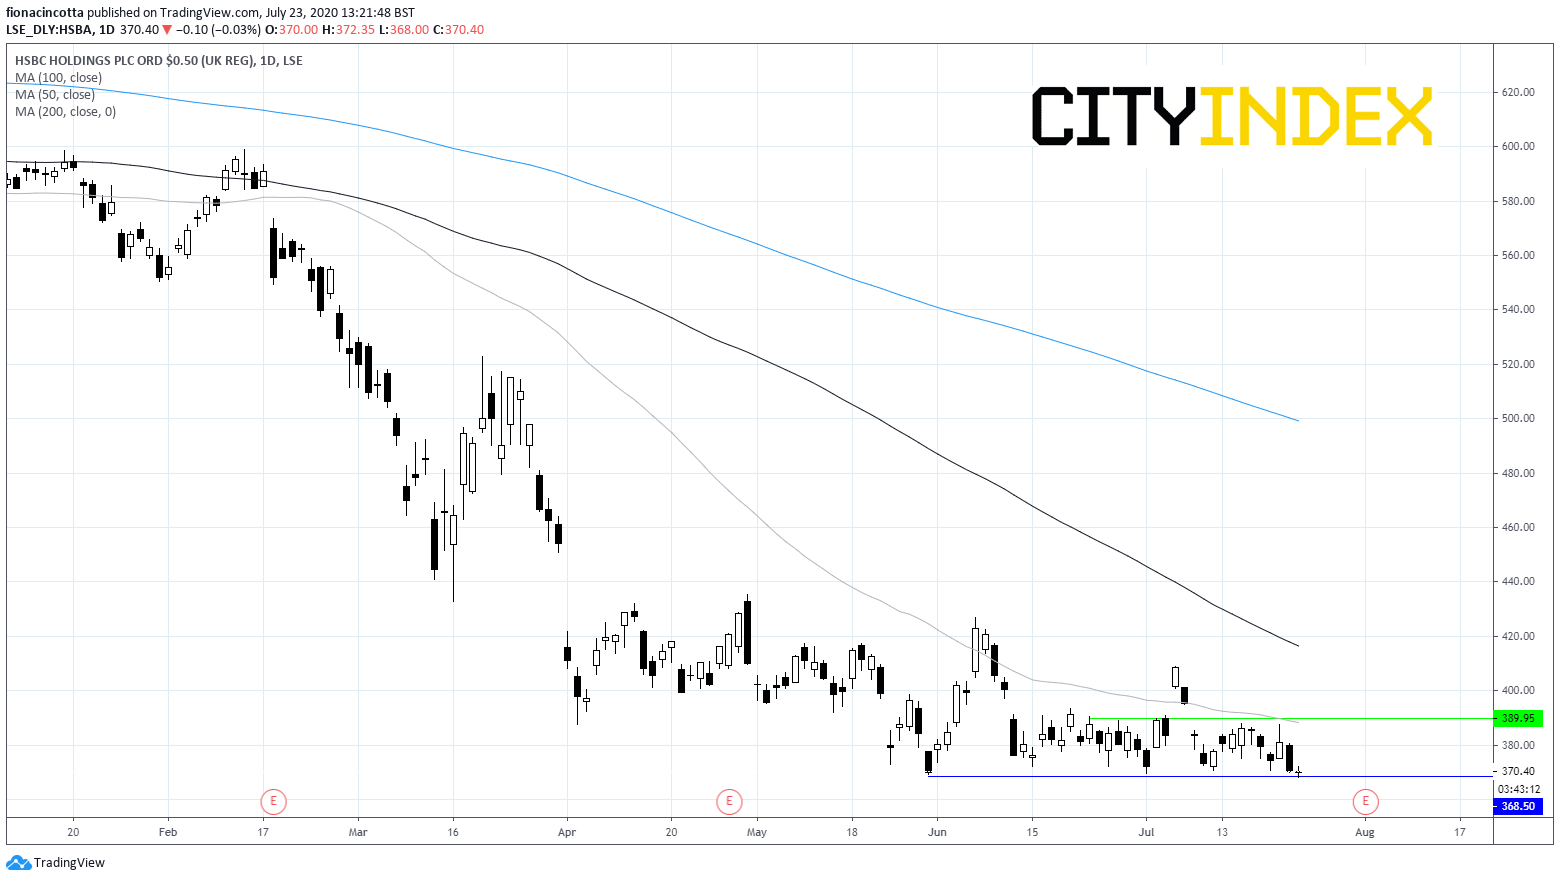
HSBC has not only failed to hold its March lows but has declined further amid a combination of covid uncertainty and troubles over Hong Kong meaning investors are giving it a wide berth. The stock trades below its 50, 100 and 200 sma on a bearish chart. A rise above 390p could negate the current bearish trend although the path of least resistance is downwards.
Related tags:




The complete CFD trading experience
Award-winning platforms, competitive spreads, low commissions and dedicated support.
We live and breathe the markets and are dedicated to helping traders realise their ambitions as we continue to set the industry bar.
Economic calendar
Web Trader platform
Our sophisticated web-based platform is packed with features.
Related articles

Klarna IPO 2025: Key Facts, Valuation & BNPL Outlook
Klarna’s long-awaited IPO lands with a ~$14B valuation target—well below its 2021 peak but far above its 2022 trough. With 111M users, ~790k merchants, and five straight profitable quarters, Klarna hopes to prove it’s more than just a BNPL pioneer. Our cheat sheet breaks down the company’s history, valuation, competitors, revenues, and what to watch as KLAR lists on the NYSE in the busiest IPO week since 2021.


JPMorgan Q4 Earnings: Growth, Risks, and Outlook
JPMorgan Chase releases Q4 earnings on Jan 15, with EPS expected at $4.03 and revenue at $41.58B. Analysts will watch net interest income, cost control, and credit provisions as rising rates boost profits but risks like delinquencies and geopolitical tensions persist. The bank has outpaced the S&P 500 in 2025 YTD, reflecting resilience. Will it maintain its streak of beating estimates? Learn about its growth drivers, risks, and market impact ahead of this pivotal report.
Earnings preview: Bank of America, Goldman Sachs & Citigroup
US financial services and banks continue to release earnings. All of them reported higher earnings numbers when compared to last year. We continue with 4 more.
StoneX Europe Ltd may make third party material available on this website which may contain information included but not limited to the conditions of financial markets. The material is for information purposes only and does not contain, and should not be construed as containing, investment advice and/or investment recommendation and/or an investment research and/or an offer of or solicitation for any transactions in financial instruments; any decision to enter into a specific transaction shall be made by the client following an assessment by him/her of their situation.
StoneX Europe Ltd makes no representation or warranty and assumes no liability as to the accuracy or completeness of the information provided, nor any loss arising from any investment based on a recommendation, forecast or other information supplied. You should always seek independent advice as to your suitability to speculate in any related markets and your ability to assume the associated risks, if you are at all unsure. We are not under any obligation to update any such material. Any opinion made may be personal to the author and may not reflect the opinion of StoneX Europe Ltd.