






Where does the Bid End for USDJPY
USD/JPY is up over 200 pips since Tuesday, crossing above 112.00 during European hours.
Share this:

USD/JPY is up over 200 pips since Tuesday, crossing above 112.00 during European hours. If you are looking for a reason, its difficult to pinpoint one. Some of this may stem back to the poor GDP data out of Japan on Monday, and the threat of further poor data in the months ahead may be likely. However, poor data hasn’t really mattered in Japan for a while now. Ironically, investors actually would buy yen on any poor data from any country. including Japan, as the yen has always been considered the “safe-haven currency”.
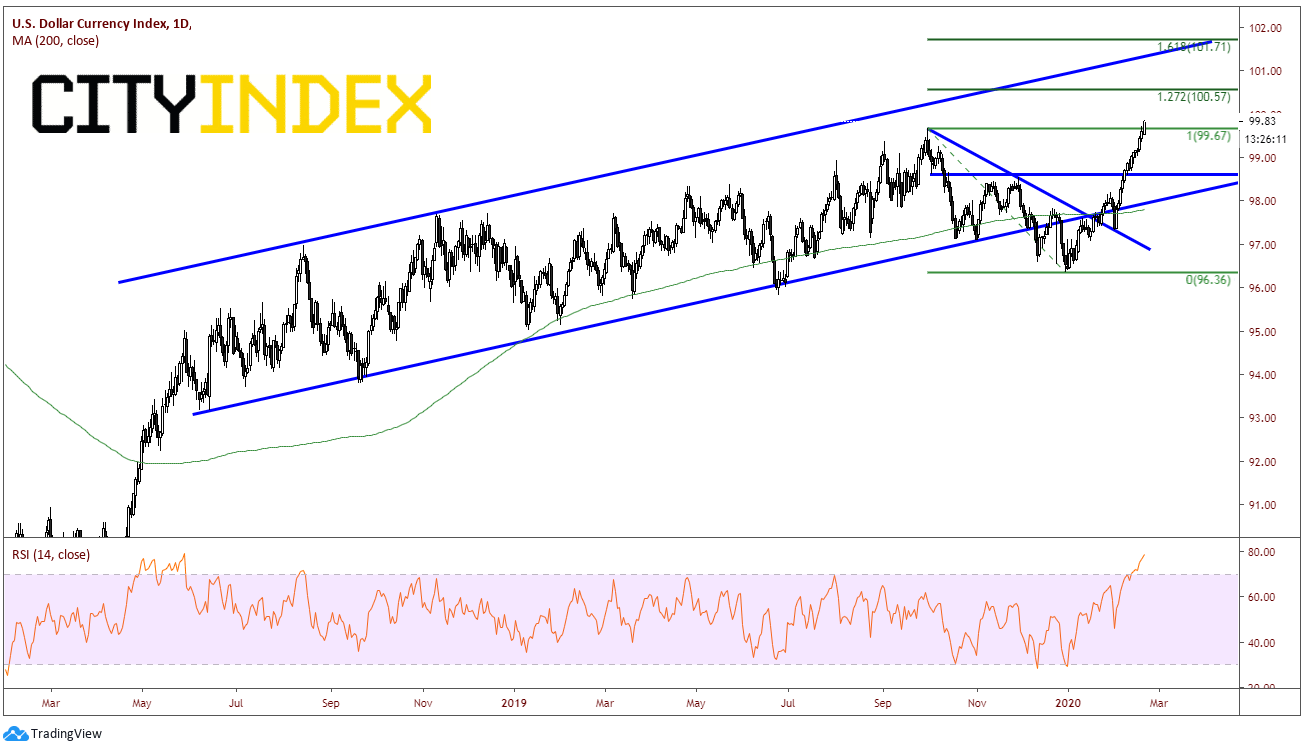
That may have changed recently, as fears spread into Japan that the coronavirus may begin to affect daily life and the further slowdowns may be ahead. As we wrote yesterday, one of the main concerns is that Tokyo is preparing for the summer Olympics. This is expected to help provide a boost to Japan’s weak economy. What will happen if Japan is unable to hold he Olympics? Tourism would drop substantially, and retail spending would be anemic. The economic data would continue to get worse. Could the coronavirus be the straw the breaks the camels back for the yen as the safe haven currency? Right now, flows are moving from Yen to US Dollars, as the DXY has broken through its recent September highs at 99.67.
Source: Tradingview, City Index
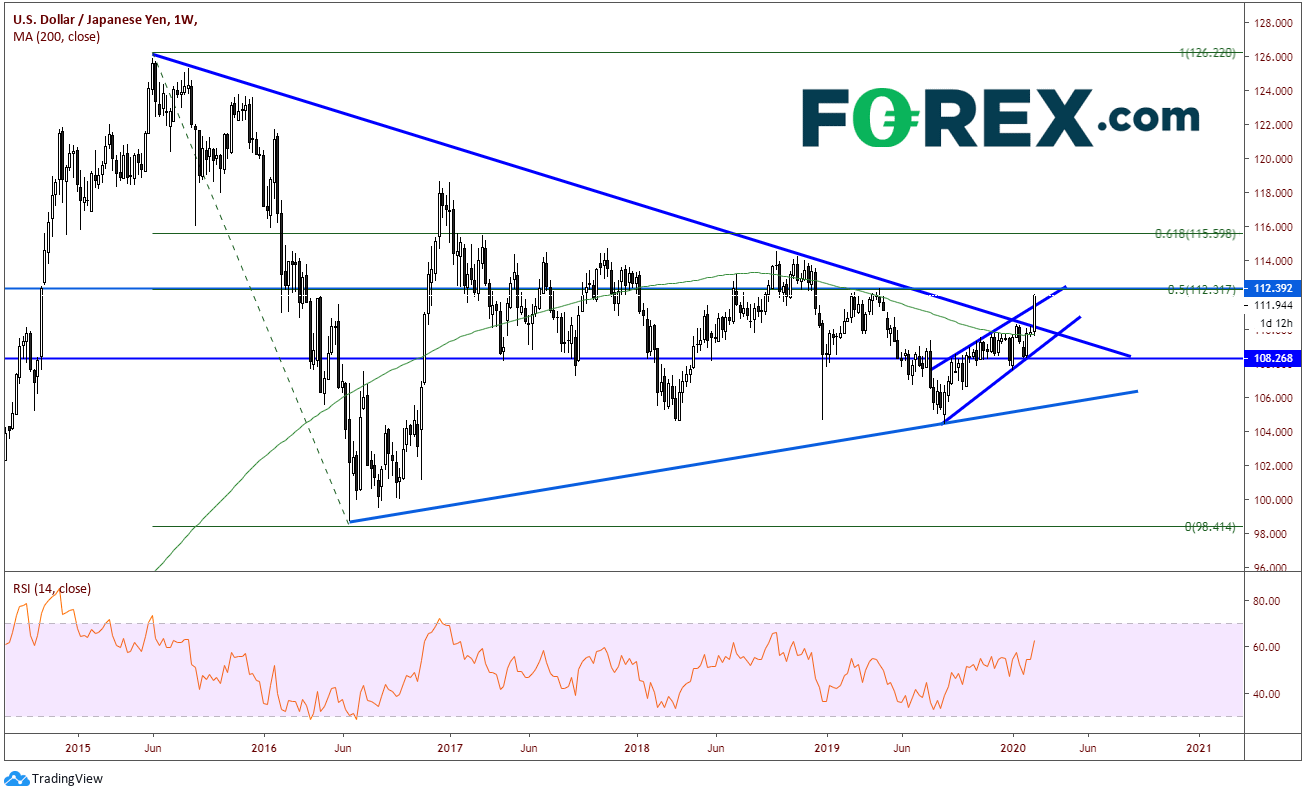
AS for the USD/JPY, on a weekly price has broken out convincingly from the long-term symmetrical triangle dating back to early 2015. In addition, the pair has moved above the recent upward sloping channel and is currently trading near 112.15. There is significant resistance at 112.40, which is not only the 50% retracement level from the January 2015 highs to the 2016 lows, but also horizontal resistance form of previous highs from early 2019 and previous lows from 2018. Above that, the next significant resistance is the 61.8% retracement level from the same time period at 115.60, over 200 pips higher!
Source: Tradingview, City Index
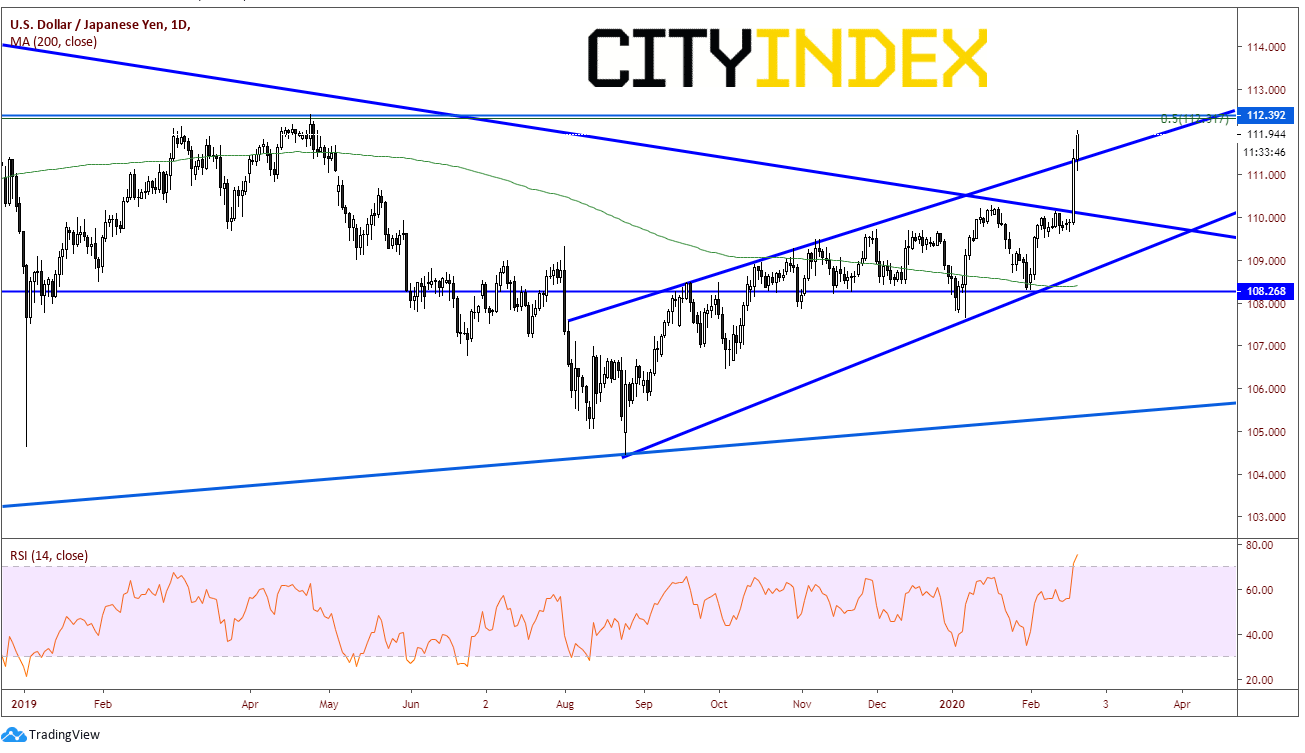
A daily timeframe gives a better picture of the extend of the recent move. Yesterday’s out sized large white candle combined with today’s candle really shows the extent of the move. Support doesn’t come in until upper trendline of the rising channel near 111.30. Notice the RSI has moved into overbought territory, a sign that the move may be ready for a pause or pullback. Next support isn’t until back at the downward sloping trendline of the long-term symmetrical triangle and horizontal support in the form of recent highs near 110.30.
Source: Tradingview, City Index
With a move of this magnitude over this short of a timeframe, don’t be surprised if USD/JPY begins to pullback a bit. However, bulls will be looking at support levels to buy and there is room for the move to continue higher. There are many factors as to the reason for the move, however watch for dips to be bought as long as downside risks in Japan continue.
USD/JPY is up over 200 pips since Tuesday, crossing above 112.00 during European hours. If you are looking for a reason, its difficult to pinpoint one. Some of this may stem back to the poor GDP data out of Japan on Monday, and the threat of further poor data in the months ahead may be likely. However, poor data hasn’t really mattered in Japan for a while now. Ironically, investors actually would buy yen on any poor data from any country. including Japan, as the yen has always been considered the “safe-haven currency”.
That may have changed recently, as fears spread into Japan that the coronavirus may begin to affect daily life and the further slowdowns may be ahead. As we wrote yesterday, one of the main concerns is that Tokyo is preparing for the summer Olympics. This is expected to help provide a boost to Japan’s weak economy. What will happen if Japan is unable to hold he Olympics? Tourism would drop substantially, and retail spending would be anemic. The economic data would continue to get worse. Could the coronavirus be the straw the breaks the camels back for the yen as the safe haven currency? Right now, flows are moving from Yen to US Dollars, as the DXY has broken through its recent September highs at 99.67.
Source: Tradingview, FOREX.com
AS for the USD/JPY, on a weekly price has broken out convincingly from the long-term symmetrical triangle dating back to early 2015. In addition, the pair has moved above the recent upward sloping channel and is currently trading near 112.15. There is significant resistance at 112.40, which is not only the 50% retracement level from the January 2015 highs to the 2016 lows, but also horizontal resistance form of previous highs from early 2019 and previous lows from 2018. Above that, the next significant resistance is the 61.8% retracement level from the same time period at 115.60, over 200 pips higher!
Source: Tradingview, FOREX.com
A daily timeframe gives a better picture of the extend of the recent move. Yesterday’s out sized large white candle combined with today’s candle really shows the extent of the move. Support doesn’t come in until upper trendline of the rising channel near 111.30. Notice the RSI has moved into overbought territory, a sign that the move may be ready for a pause or pullback. Next support isn’t until back at the downward sloping trendline of the long-term symmetrical triangle and horizontal support in the form of recent highs near 110.30.
Source: Tradingview, FOREX.com
With a move of this magnitude over this short of a timeframe, don’t be surprised if USD/JPY begins to pullback a bit. However, bulls will be looking at support levels to buy and there is room for the move to continue higher. There are many factors as to the reason for the move, however watch for dips to be bought as long as downside risks in Japan continue.
Latest market news




The complete CFD trading experience
Award-winning platforms, competitive spreads, low commissions and dedicated support.
We live and breathe the markets and are dedicated to helping traders realise their ambitions as we continue to set the industry bar.
Economic calendar
Web Trader platform
Our sophisticated web-based platform is packed with features.
Related articles
EUR/USD weekly outlook: Oil, inflation and NFP in focus
After coming under significant pressure in recent weeks, the EUR/USD came off its lows to finish the week on a positive note on Friday, albeit with only a mild rebound. That was not enough to prevent the exchange rate falling for the third consecutive week, as the US dollar and bond yields rallied across the board.


EUR/USD Q4 2026 Outlook: Euro at a Crossroads as Fed, ECB Tighten 9 25 2026
EUR/USD enters Q4 at a pivotal inflection point as competing Fed-ECB policy paths and persistent inflation risks collide with major technical support.


USD/JPY Q4 2026 Outlook: Hawkish Fed Pricing Clashes With Intervention Risk
The year-end tug-of-war is clear: hawkish Fed pricing supports USD/JPY, while intervention risk limits the upside.

StoneX Europe Ltd may make third party material available on this website which may contain information included but not limited to the conditions of financial markets. The material is for information purposes only and does not contain, and should not be construed as containing, investment advice and/or investment recommendation and/or an investment research and/or an offer of or solicitation for any transactions in financial instruments; any decision to enter into a specific transaction shall be made by the client following an assessment by him/her of their situation.
StoneX Europe Ltd makes no representation or warranty and assumes no liability as to the accuracy or completeness of the information provided, nor any loss arising from any investment based on a recommendation, forecast or other information supplied. You should always seek independent advice as to your suitability to speculate in any related markets and your ability to assume the associated risks, if you are at all unsure. We are not under any obligation to update any such material. Any opinion made may be personal to the author and may not reflect the opinion of StoneX Europe Ltd.