Earlier today, China's official Manufacturing PMI rose to a 6-month high of 51.5 in September (51.3 expected) from 51.0 in August and Non-manufacturing PMI climbed to the highest level since November 2013 at 55.9 (54.7 expected) from 55.2. On the other hand, China's Caixin Manufacturing PMI slipped to 53.0 in September (53.1 expected) from 53.1 in August. Australian economy remains closely linked to China.
From a technical point of view, on a daily chart, AUD/USD has broken below an internal rising trend line and stands below its 50-day moving average (in blue). Readers may therefore consider the potential for further weakness below horizontal resistance at 0.7200. The nearest threshold would be set at September bottom at 0.7000 and a second one would be set at horizontal support at 0.6800 in extension.
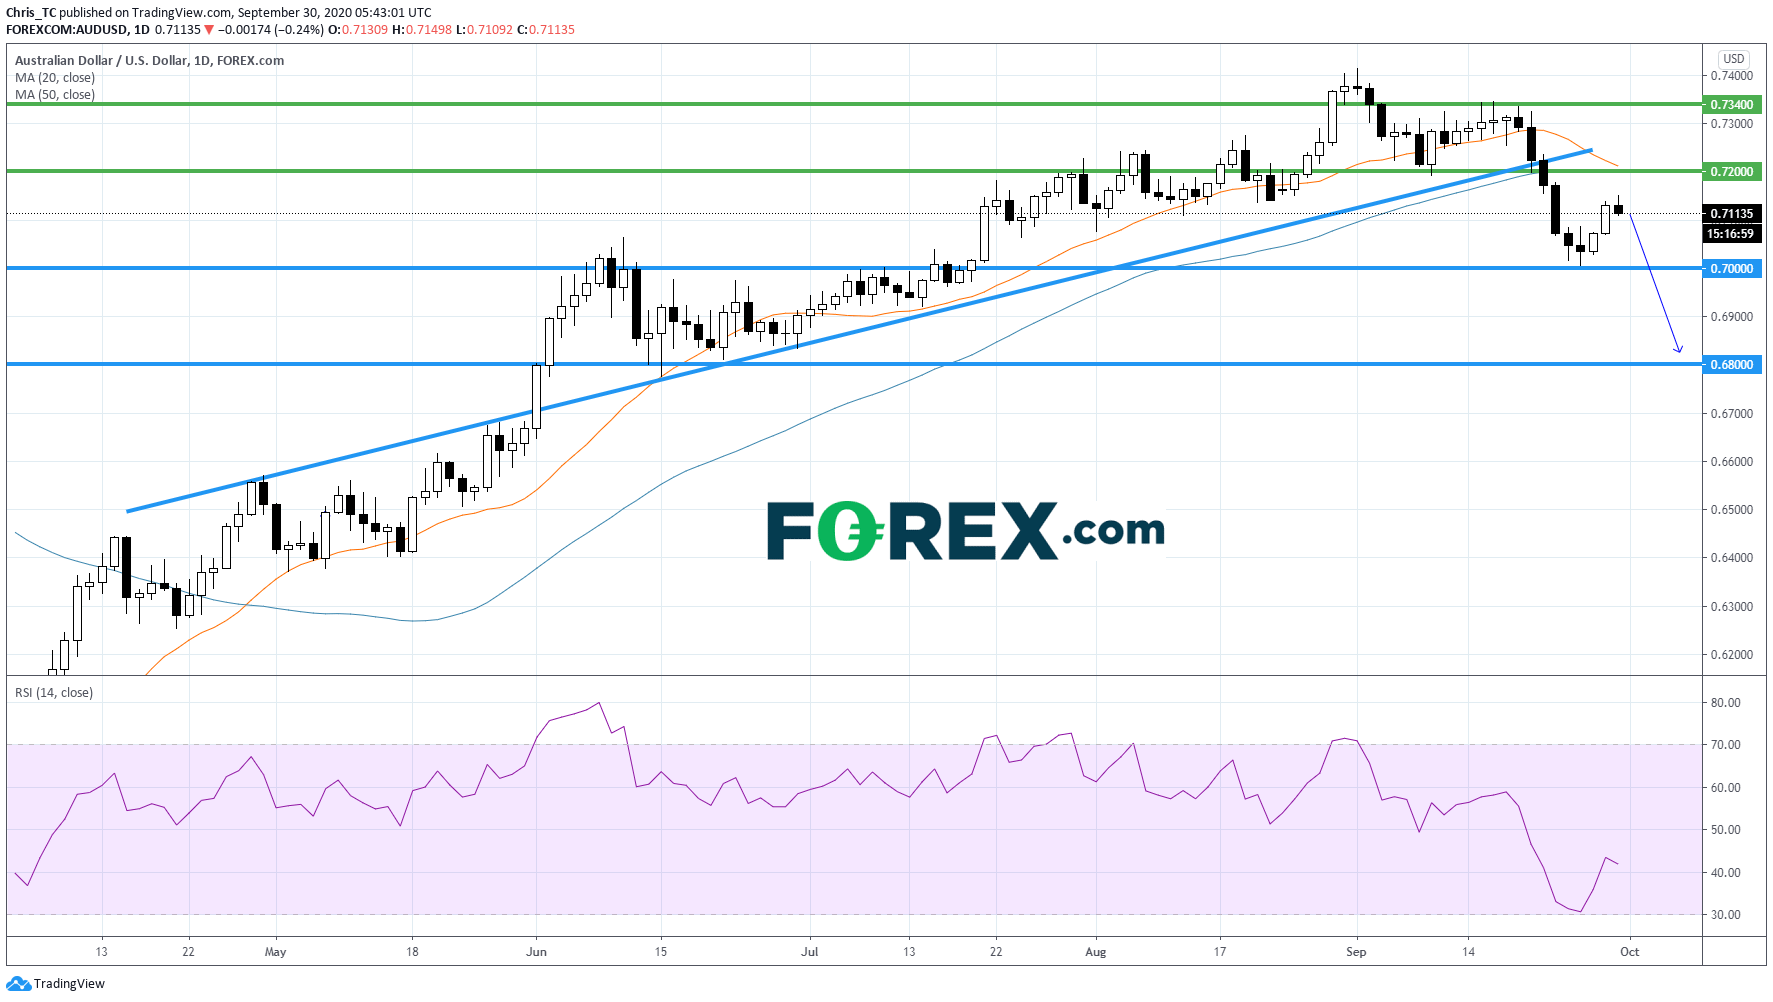
Source: TradingView, GAIN Capital