



2026 Bitcoin Outlook: A Mixed Outlook Augurs for Shorter-Term Trades
With Bitcoin's technicals, fundamentals, and sentiment painting a mixed picture, readers should defer to the key technical levels for near-term setups, rather than rigidly maintaining a strong directional bias throughout the year.
Share this:

Bitcoin Key Points
- The historically-reliable 4-year halving cycle suggests that Bitcoin may have peaked in late 2025, but…
- Other measures, including valuations, ETF purchases, and global money supply point to potential upside in 2026.
- Accordingly, readers should defer to the key technical levels for near-term setups, rather than rigidly maintaining a strong directional bias throughout the year.
Bitcoin Q4 2025 in Review
In our Bitcoin Q4 outlook, we asked a provocative question: Is Bitcoin’s historically-reliable 4-year cycle dead? While its premature to say definitively just one quarter after it would have usually projected a peak, Q4’s bearish price action (-20% or so as of writing in mid-December) hints that it may still be kicking.
Below, we break down the outlook for the king of cryptocurrencies and highlight relevant fundamental and technical trends that will drive Bitcoin in the coming year.
Bitcoin 2026 Outlook
As we noted last quarter, many analysts have identified a reliable 4-year cycle centered around the Bitcoin Halving that projected a potential peak in September.
For the uninitiated, the Bitcoin Halving is when the reward for mining new bitcoins is cut in half. This reduces the rate at which new bitcoins are created and thus lowers the total supply of new bitcoin coming into the market. The halving tends to increase scarcity and historically has led to an increase in the price of bitcoin, though of course it's not guaranteed to do so in the future. As any Bitcoin bull will tell you, the April 2024 halving took the “inflation rate” of Bitcoin’s supply to below 1% per year, less than half of gold’s annual inflation rate.
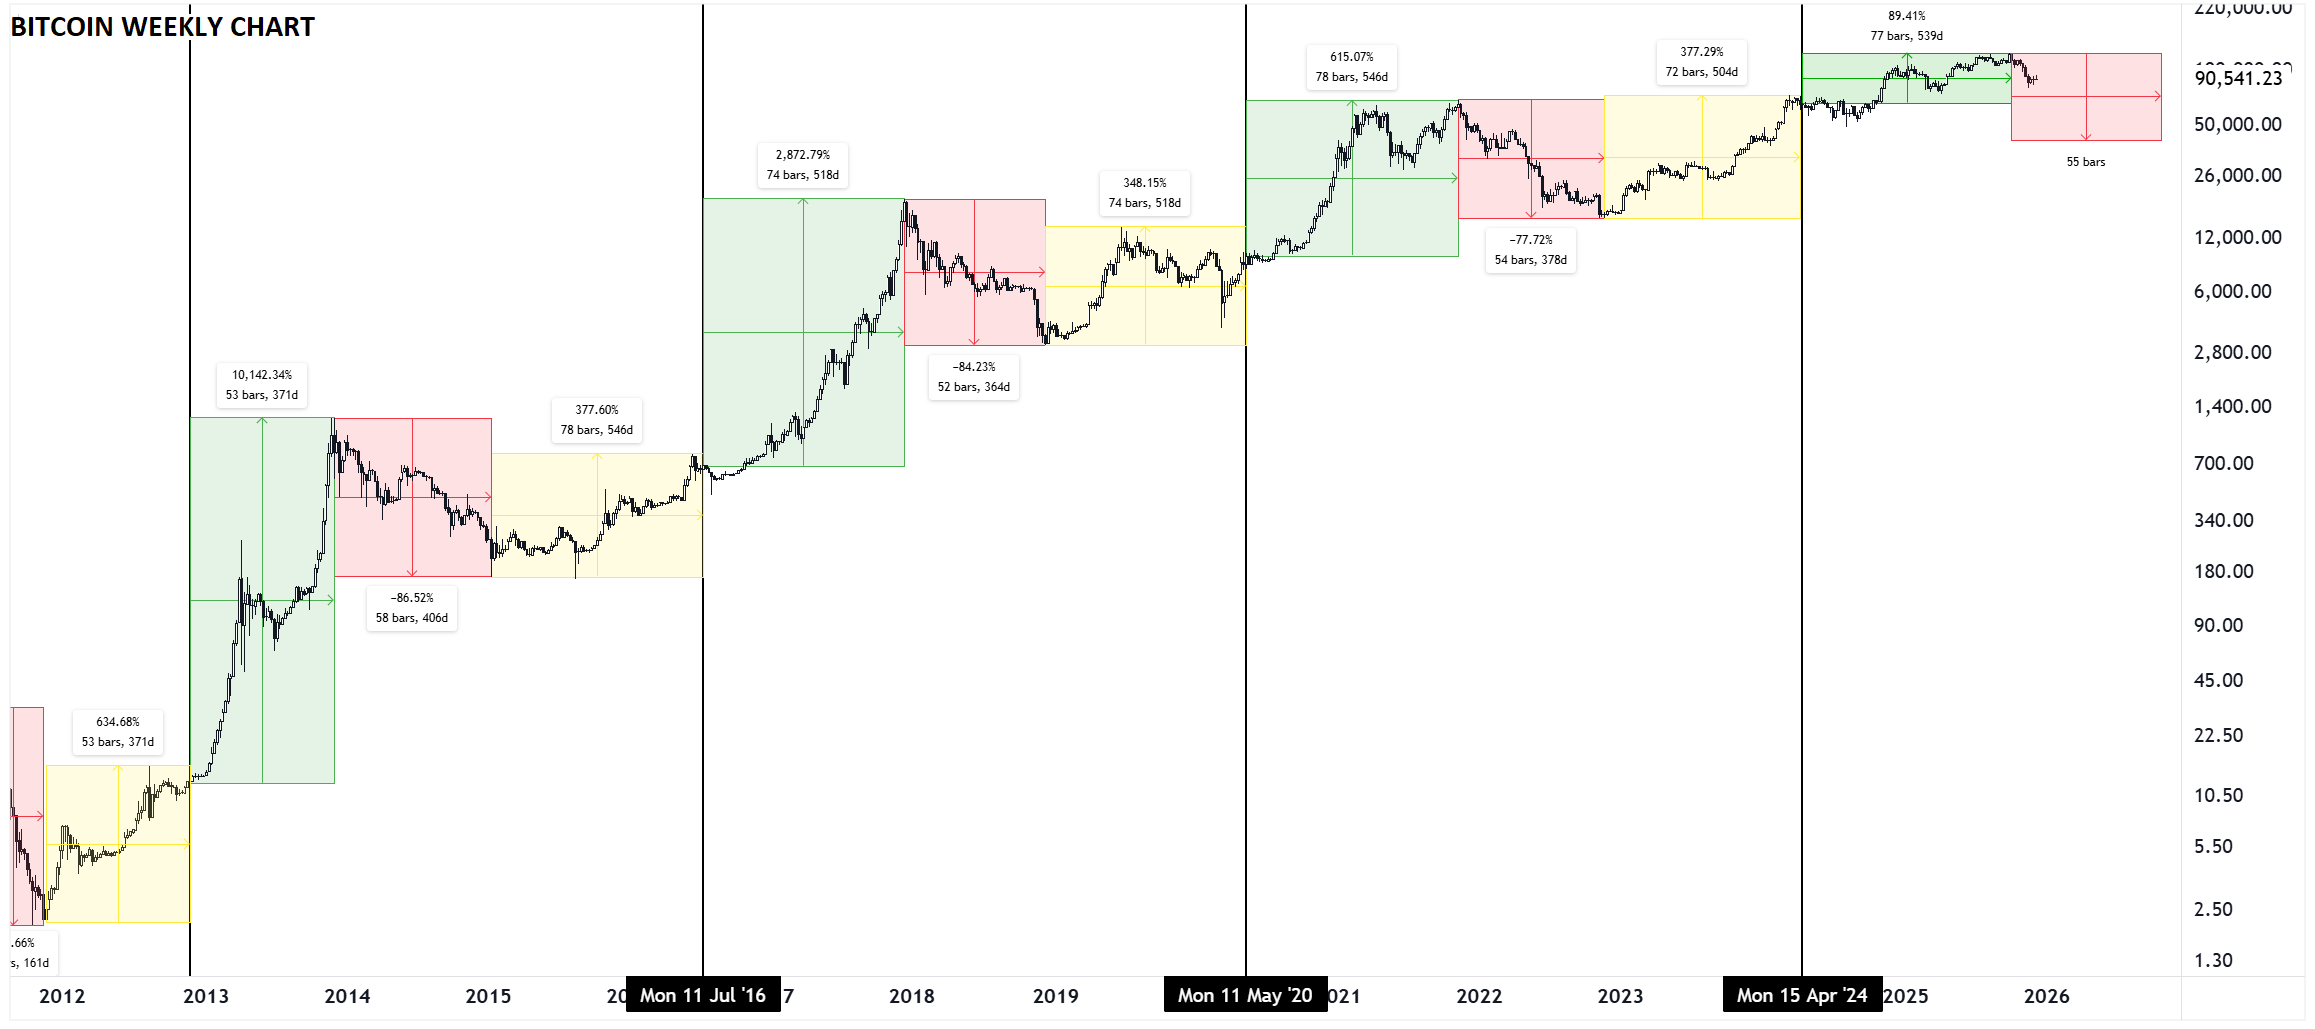
Looking at my favorite chart, which I colloquially call “The Only Bitcoin Chart You'll Ever Need™”, previous Bitcoin halvings have marked the transition from the (yellow) post-bottom recovery rally stage to the (green) full-blown bull market stage that we’ve been in since April of last year.
Projecting a similar time-based cycle forward from the last halving suggests that we may have reached the peak of the current cycle at the start of Q4:
Source: TradingView, StoneX. Past performance is no guarantee of future returns.
Beyond the 4-yearh cycle itself, the fundamental and technical outlook for Bitcoin is also less bullish (though not outright bearish) than it’s been in several quarters, raising the risk of a neutral-to-negative 2026 for the cryptocurrency.
From a macroeconomic perspective, the monetary policy backdrop remains generally supportive, though we may be nearing a shift toward tightening if central bank expectations play out as expected. As the chart below shows, global central banks have still been cutting interest rates generally, but we have seen that trend stalling in recent months, with major central banks like the ECB, BOJ, BOC and RBA expected to start raising interest rates in the coming year:

Source: MacroMicro
Looking ahead, the risk that central banks shift focus back to the risks of re-accelerating inflation may develop into a potential headwind for Bitcoin as we move through 2026, especially amidst generally accommodative fiscal policy across the globe.
In that vein, the growth rate fiat money in the financial system has turned to a more stimulative direction. So-called “M2” is central banks’ estimate of the total money supply, including all the cash people have on hand, plus all the money deposited in checking accounts, savings accounts, and other short-term saving vehicles such as certificates of deposit (CDs).
The year-over-year growth in global money supply has accelerated in recent months and is near 4-year highs at 9%+ as we go to press:

Source: TradingView, StoneX.
One of the key narratives driving Bitcoin’s value is the idea of “hard money” or a hedge against fiat currency debasement, and as long as the global supply of money continues to increase, that theme could put a floor under the cryptocurrency’s price.
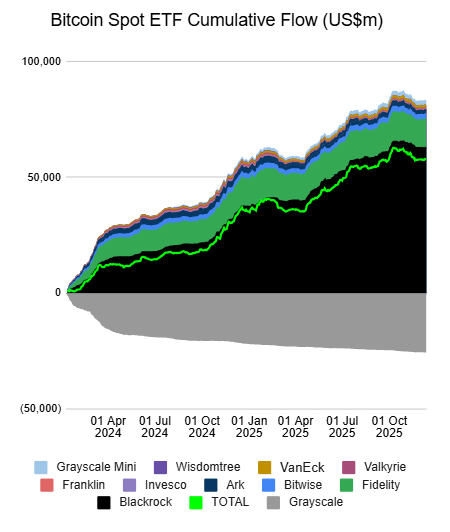
Beyond broad macroeconomic dynamics, a key theme support Bitcoin in recent years has been accumulation by large financial institutions and mom-and-pop investors. In addition to the growing popularity of firms accumulating the cryptocurrency as a treasury asset, we’ve also seen impressive inflows from “TradFi” institutional investors buying spot Bitcoin ETFs, with total inflows into Bitcoin ETFs near $60B, albeit down slightly from the early Q4 peak:
Source: Farside Investors
Broadly speaking, as long as “TradFi” ETF purchases remain positive, downside dips in Bitcoin may be more limited than they have in the past.
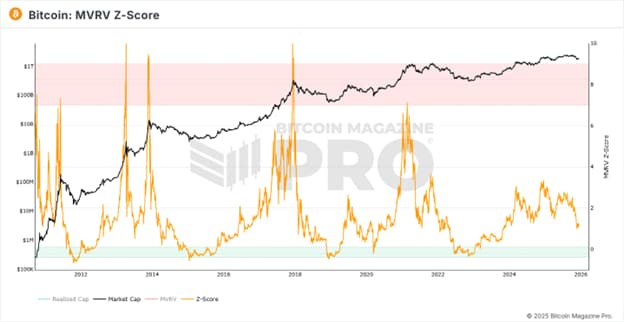
From a valuation perspective, the MVRV (Market Value to Realized Value) Z-score, which compares the current price to the aggregate cost paid for all outstanding Bitcoin, has fallen to just 1.2, closer to the typical bear market bottom zone at 0 than the recent peak above 3.
Source: Bitcoin Magazine. Past performance is not indicative of future returns.
Broadly speaking, this may be one of the best signals that the typical 4-year cycle is losing its significance, as the indicator never even approached they typical bull market peak zone near 7 before rolling over to close 2025. Time will tell whether this indicator remains a reliable measure moving forward.
A final consideration is the behavior of long-term holders. As we’ve noted in previous outlooks, those who have held their Bitcoin for more than a year, almost tautologically, are not trying to make a “quick buck” off the cryptocurrency; rather they are more likely to be “true believers” or “HODLers” who are unlikely to sell unless they’re sitting on a truly massive gain.
As the chart below shows, the proportion of Bitcoin that has been held for at least a year started 2024 at record highs above 70% before seeing a notable decline to below 59% as of writing. While that -11% drop may seem relatively small, it represents over 2 million BTC in marginal Bitcoin supply, weighing on the Bitcoin price. This measure, by definition, moves relatively slowly, but any renewed selling from longer-term “HODLers” may offset inflows into ETFs as we move through 2026:

Source: MacroMicro.me
Taking these diverse forms of analysis in totality, the outlook for Bitcoin in 2026 is mixed: While valuations, money supply, and ETF purchases signal continued upside potential, a shift in monetary policy, the behavior of long-term holders, and the 4-year cycle (if still valid) all point to weakness over the coming year. Accordingly, it makes sense to defer to the technical outlook (below) throughout the year and watch the key levels for near-term setups, rather than staking out a strong position and maintaining it all year.
Of course, the catalysts we highlight in this report may not play out as expected – and to some extent, they may already be priced in, so readers should always exercise caution when trading Bitcoin and other cryptoassets. As ever, it will be critical to monitor a broad swath of macroeconomic and crypto-specific metrics as the year develops.
Bitcoin Technical Analysis – BTC/USD Weekly Chart
Source: TradingView, StoneX
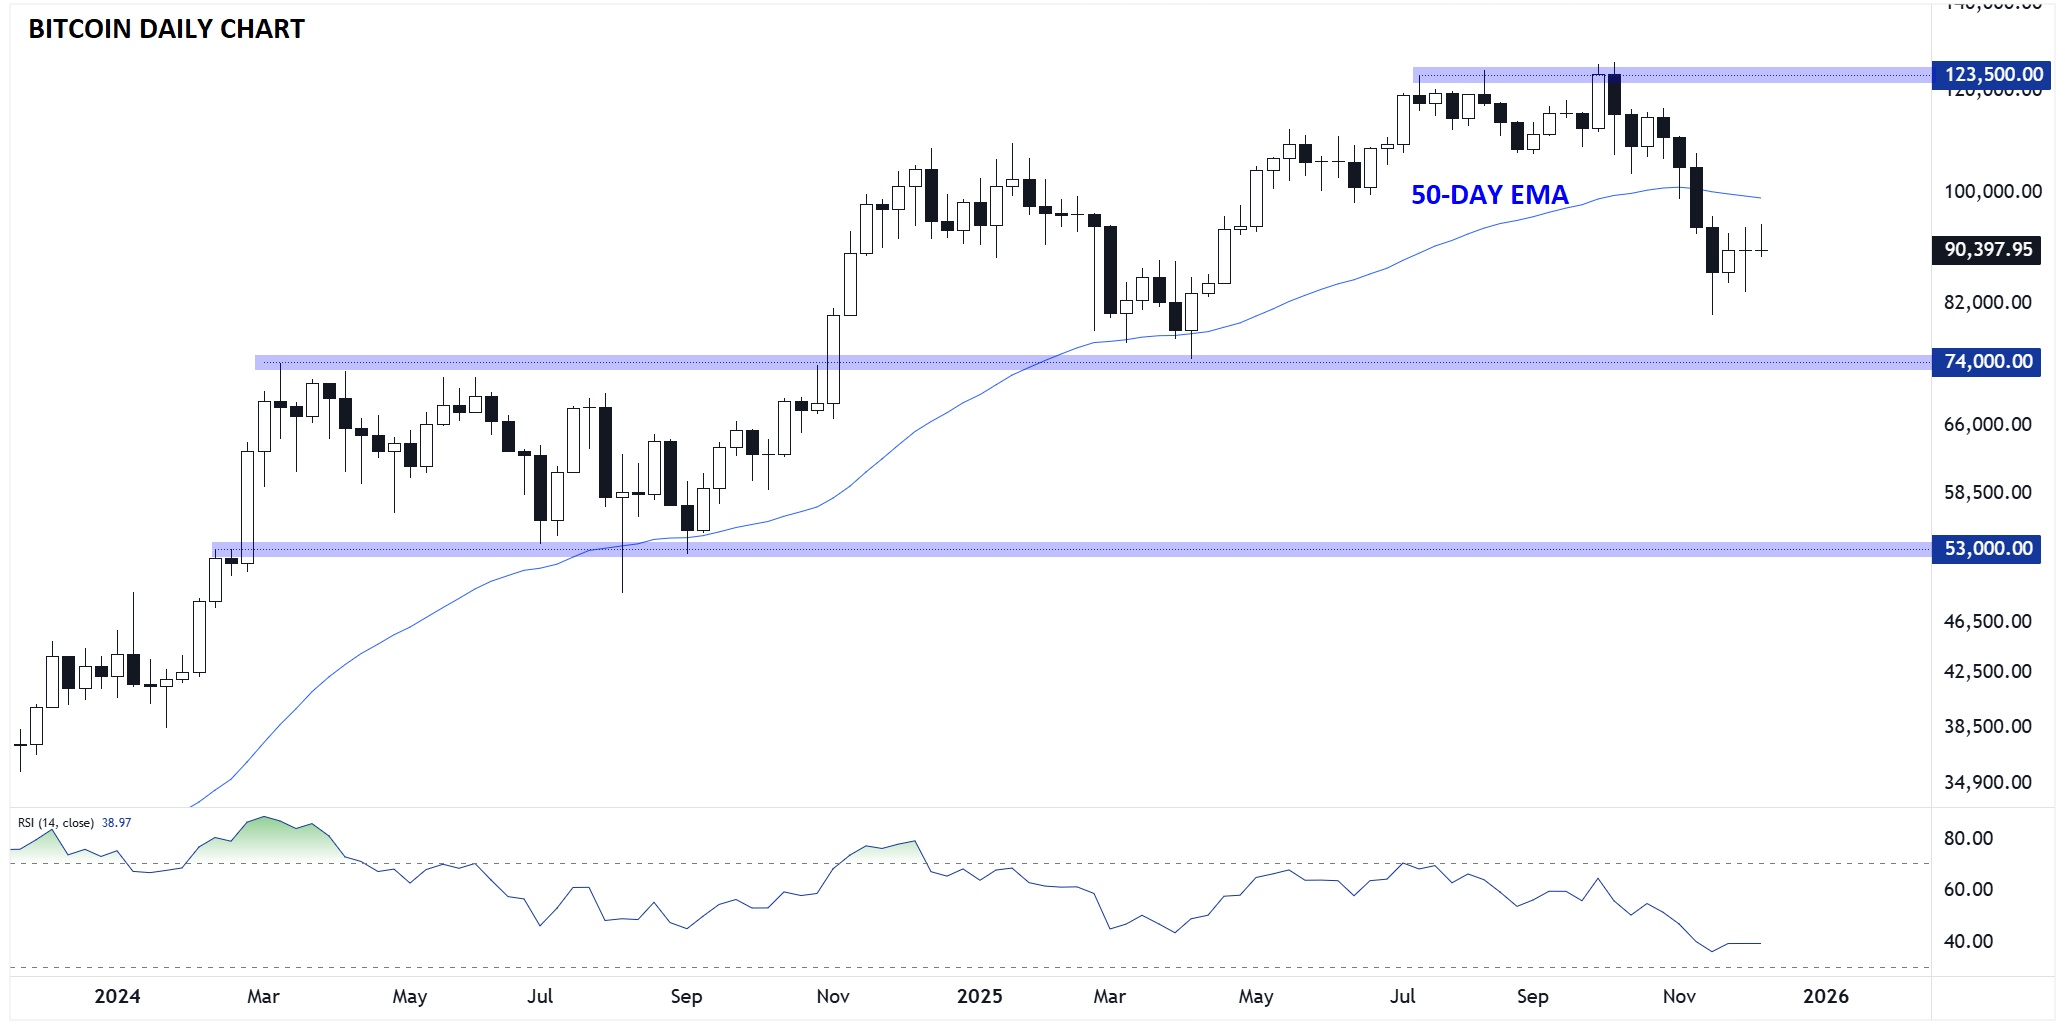
Looking at the longer-term chart, Bitcoin’s Q4 drop has undoubtedly take the shine of the cryptocurrency, though it hasn’t done substantial technical damage (yet?). The pattern of higher highs and higher lows (the textbook definition of an uptrend) remains intact as long as support at $74K, keeping hopes alive for a rally to new highs in 2026.
That said, Bitcoin has broken below its 50-day EMA for the first time in years, and the 14-week RSI is holding below 40 as we go to press, suggesting the bullish trend may be coming to an end. If the $74K level gives way at any point in 2026, it would set the stage for a deeper pullback into the 2024 range, with the bottom of that range sitting down at $53K.
-- Written by Matt Weller, Global Head of Research
Follow Matt on Twitter: @MWellerFX




Open an account in minutes
Experience award-winning platforms with fast and secure execution, and enjoy tight spreads from 0.5 pts on FX and 0.3 pts on indices.
Economic calendar
Web Trader platform
Our sophisticated web-based platform is packed with features.
Related articles
USD/JPY weekly outlook: Quarter turn scrambles rates regime
USD/JPY’s tight relationship with front-end US rates broke down sharply last week, but quarter-turn flows and positioning suggest the disconnect may prove temporary.

What Stretched 10-Year Yields Mean for Major Currency Pairs in Q4
U.S. 10-year Treasury yields are nearing a long-term resistance zone with overbought RSI readings, raising near-term pullback risk for the dollar.


USD/CAD shooting star puts September surge on notice
USD/CAD has printed a clear bearish reversal pattern after an extraordinary September surge, but confirmation may depend heavily on how US Treasury yields react to Friday’s payrolls report.
This report is intended for general circulation only. It should not be construed as a recommendation, or an offer (or solicitation of an offer) to buy or sell any financial products. The information provided does not take into account your specific investment objectives, financial situation or particular needs. Before you act on any recommendation that may be contained in this report, independent advice ought to be sought from a financial adviser regarding the suitability of the investment product, taking into account your specific investment objectives, financial situation or particular needs.
StoneX Financial Pte. Ltd., may distribute reports produced by its respective foreign entities or affiliates within the StoneX group of companies or third parties pursuant to an arrangement under Regulation 32C of the Financial Advisers Regulations. Where the report is distributed to a person in Singapore who is not an accredited investor, expert investor or an institutional investor (as defined in the Securities Futures Act), StoneX Financial Pte. Ltd. accepts legal responsibility to such persons for the contents of the report only to the extent required by law. Singapore recipients should contact StoneX Financial Pte. Ltd. at 6826 9988 for matters arising from, or in connection with the report.
In the case of all other recipients of this report, to the extent permitted by applicable laws and regulations neither StoneX Financial Pte. Ltd. nor its associated companies will be responsible or liable for any loss or damage incurred arising out of, or in connection with, any use of the information contained in this report and all such liability is hereby expressly disclaimed. No representation or warranty is made, express or implied, that the content of this report is complete or accurate.
StoneX Financial Pte. Ltd. is not under any obligation to update this report.
Trading CFDs carries a high level of risk that may not be suitable for some investors. Consider your investment objectives, level of experience, financial resources, risk appetite and other relevant circumstances carefully. The possibility exists that you could lose some or all of your investments, including your initial deposits. If in doubt, please seek independent expert advice. Visit www.forex.com/en-sg/terms-and-policies for the complete Risk Disclosure Statement.