



ASX 200 Rally Stalls as Financials Weigh on Index
The ASX 200 pulled back for a second day as financials weighed on the index, while materials helped cushion the decline near record highs.
Share this:

The ASX 200 pulled back for a second consecutive session after reaching a record high last Thursday, with financials leading the decline. While materials remain closely aligned with the broader index and are helping to cushion weakness, technical momentum has started to fade. The index is now testing support around 9,200, with the RBA's policy decision adding a potential catalyst for the next move.
View related analysis:
View related analysis:
ASX 200 Rally Stalls as Financials Weigh on Index
ASX 200 Market Snapshot
- The ASX 200 closed lower for a second day after reaching its latest record high on Thursday.
- Its daily range was quite narrow, although that has generally been the case in recent months, with volatility tending to increase towards Friday.
- Market breadth was mostly balanced, with 98 stocks advancing, 88 declining and 14 unchanged.
- Telecoms and healthcare led the seven ASX sectors higher, while financials and consumer discretionary led the four declining sectors lower.
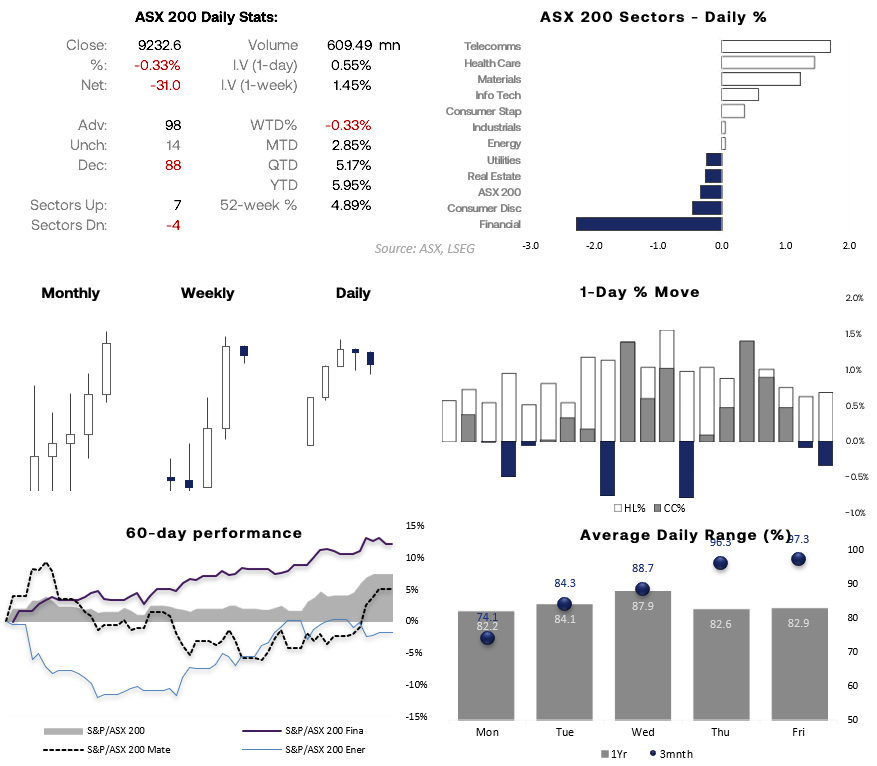
Source: ASX, LSEG
Financials Diverge as Materials Support ASX 200 Strength
The correlation data highlights a notable divergence between the ASX 200's two largest sectors. Materials have become increasingly aligned with the broader index, with their 20-day correlation rising to 0.90 and 10-day correlation to 0.92. Financials, meanwhile, have pulled back sharply from their recent highs, with their 10-day correlation falling to 0.50. This suggests recent weakness in the ASX 200 is being driven more by financials, while strength in materials is helping to cushion the broader index.
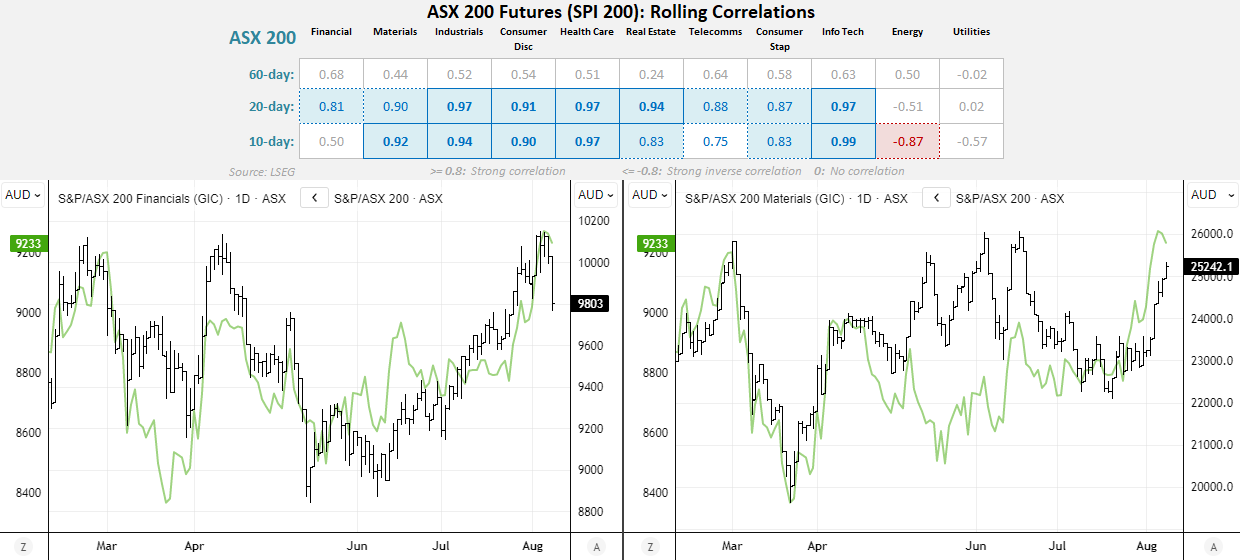
Source: ASX, LSEG
ASX 200 Faces Resistance as Rally Loses Momentum
The daily chart on the left shows a solid rally into its record high last Thursday, although the ASX 200 has retreated for a second day on Monday. Support has so far been found around 9,200, which also marks the February high and an options cluster. A break beneath this level could see the ASX retreat towards its 10-day EMA at 9,123.6, followed by the 9,100 handle, which is also a significant options-based support level. The daily RSI (14) remains overbought, suggesting the recent rally has become stretched.
This content was created by an affiliate of FOREX.com and represents the views and opinions of the author/speakers, not the views and opinions of FOREX.com, StoneX Group Inc., or its subsidiaries. The content has not been independently reviewed by FOREX.com.
ASX 200 Options Positioning Highlights 9,200 and 9,300
The SPI 200 futures chart on the right shows an intraday break above the March high followed by a reversal lower. At current levels, futures are on track to form a bearish outside day around their record high. Declining volumes during the broader rally also suggest participation has not kept pace with the strength of the price advance. Meanwhile, falling open interest indicates some position unwinding rather than providing a clear bullish confirmation. The options market adds another layer to the picture: 9,250 is a key battleground, while 9,300 represents nearby resistance, potentially making further gains harder to sustain without a decisive break higher. Conversely, 9,200 remains the key level for bears to target, with a break opening the way towards 9,100.
If the RBA delivers a hawkish hold tomorrow, it could add to selling pressure and increase the risk of the ASX 200 breaking below 9,200.
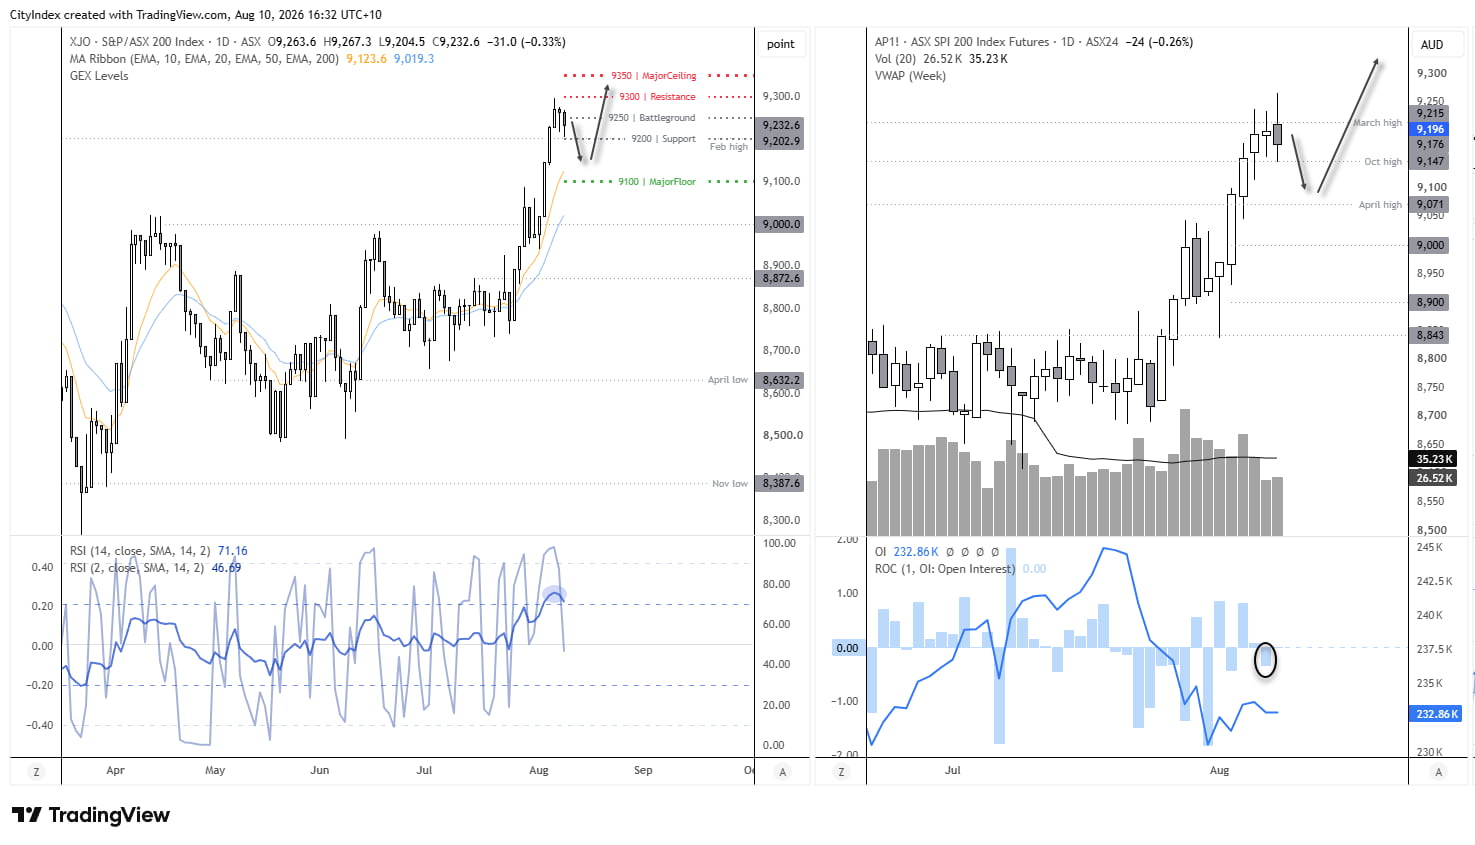
Source: ASX, TradingView
View the full economic calendar
View the full economic calendar
-- Written by Matt Simpson
Follow Matt on Twitter @cLeverEdge
How to trade with City Index
You can trade with City Index by following these four easy steps:
- Open an account, or log in if you’re already a customer
• Open an account in the UK
• Open an account in Australia
• Open an account in Singapore
- Search for the market you want to trade in our award-winning platform
- Choose your position and size, and your stop and limit levels
- Place the trade
Related tags:
Latest market news




Open an account in minutes
Experience award-winning platforms with fast and secure execution, and enjoy tight spreads from 0.5 pts on FX and 0.3 pts on indices.
Economic calendar
Web Trader platform
Our sophisticated web-based platform is packed with features.
Related articles
Gold forecast: XAU/USD stabilised after recent falls – for now
Gold has started the first week of the new month trying to recover some ground after another bruising week. Oil prices have taken a sharp drop and that has allowed risk assets to bounce back, which has clearly helped the precious metal too. However, with sentiment remaining bearish towards the metals, and with $4000 level having been taken out last week, the path of least resistance is to the downside for gold.


GBP/USD outlook: Currency Pair of the Week | November 2, 2026
The GBP/USD heads into a crowded week of event risk, with the midterm elections, a Bank of England rate decision and Friday's non-farm payrolls report all capable of moving markets sharply. The greenback remains fundamentally well supported by a hawkish Federal Reserve, but much of that is already priced in, while the renewed sell-off in technology stocks has exposed its vulnerability.

Have Markets Found a Turning Point Ahead of the Elections?
Fed rate-hike bets topping 70% have pressured markets, including precious metals and U.S. indices, toward key support levels. Could these levels signal a turning point ahead of the U.S. midterm elections?

This report is intended for general circulation only. It should not be construed as a recommendation, or an offer (or solicitation of an offer) to buy or sell any financial products. The information provided does not take into account your specific investment objectives, financial situation or particular needs. Before you act on any recommendation that may be contained in this report, independent advice ought to be sought from a financial adviser regarding the suitability of the investment product, taking into account your specific investment objectives, financial situation or particular needs.
StoneX Financial Pte. Ltd., may distribute reports produced by its respective foreign entities or affiliates within the StoneX group of companies or third parties pursuant to an arrangement under Regulation 32C of the Financial Advisers Regulations. Where the report is distributed to a person in Singapore who is not an accredited investor, expert investor or an institutional investor (as defined in the Securities Futures Act), StoneX Financial Pte. Ltd. accepts legal responsibility to such persons for the contents of the report only to the extent required by law. Singapore recipients should contact StoneX Financial Pte. Ltd. at 6826 9988 for matters arising from, or in connection with the report.
In the case of all other recipients of this report, to the extent permitted by applicable laws and regulations neither StoneX Financial Pte. Ltd. nor its associated companies will be responsible or liable for any loss or damage incurred arising out of, or in connection with, any use of the information contained in this report and all such liability is hereby expressly disclaimed. No representation or warranty is made, express or implied, that the content of this report is complete or accurate.
StoneX Financial Pte. Ltd. is not under any obligation to update this report.
Trading CFDs carries a high level of risk that may not be suitable for some investors. Consider your investment objectives, level of experience, financial resources, risk appetite and other relevant circumstances carefully. The possibility exists that you could lose some or all of your investments, including your initial deposits. If in doubt, please seek independent expert advice. Visit www.forex.com/en-sg/terms-and-policies for the complete Risk Disclosure Statement.