





ASX 200 Rally Stalls Below Key Resistance as Seasonal Tailwinds Fade
ASX 200 struggles near key highs as bearish signals emerge. Can seasonal strength in July keep bulls in control—or is a reversal brewing?
Share this:

The S&P/ASX 200 Index (ASX 200) has staged an impressive rally since its April low, rising nearly 20% in under three months. But the momentum that fuelled the Australia 200 to multi-month highs now appears to be fading, as bearish signals emerge near key resistance. As we enter the second half of July, historical seasonality remains in favour of the bulls—but the technicals suggest caution may be warranted.
View related analysis:
View related analysis:
S&P ASX 200 Cash (Australia 200) Technical Analysis:
While the S&P/ASX 200 Index is currently holding above the 20-day EMA, buyers are struggling to push the index beyond the February high. This has allowed a bearish divergence to build on the daily RSI. More concerning is the bearish engulfing candle that formed on Wednesday, just below the all-time high (ATH). The fact that this 2-bar reversal pattern formed around key resistance suggests growing selling pressure, and raises the risk of a counter-trend move developing from these levels.

Chart analysis by Matt Simpson - Source: TradingView, S&P/ASX 200 Index
ASX 200 (Australia 200) Seasonality – July Trends
While short-term price action suggests the potential for a pullback, it's worth noting that July is historically a strong month for the ASX 200. Over the past 33 years, the S&P/ASX 200 Index has delivered an average return of 1.56%, with gains in 69.7% of July sessions.
Drilling into the numbers, the average gain in a positive July is +3.4%, while the average decline during negative Julys is -2.8%, skewing the seasonal bias in favour of bullish outcomes. That said, seasonality is never guaranteed—macro fundamentals and risk sentiment can easily override historical averages.
So far, the ASX 200 has only gained 0.23% in the first half of July, meaning bulls will need strong follow-through in the second half of the month to meet the seasonal norm. But if the index stumbles, this historical tailwind may still offer technical support, unless a broader risk-off environment emerges.
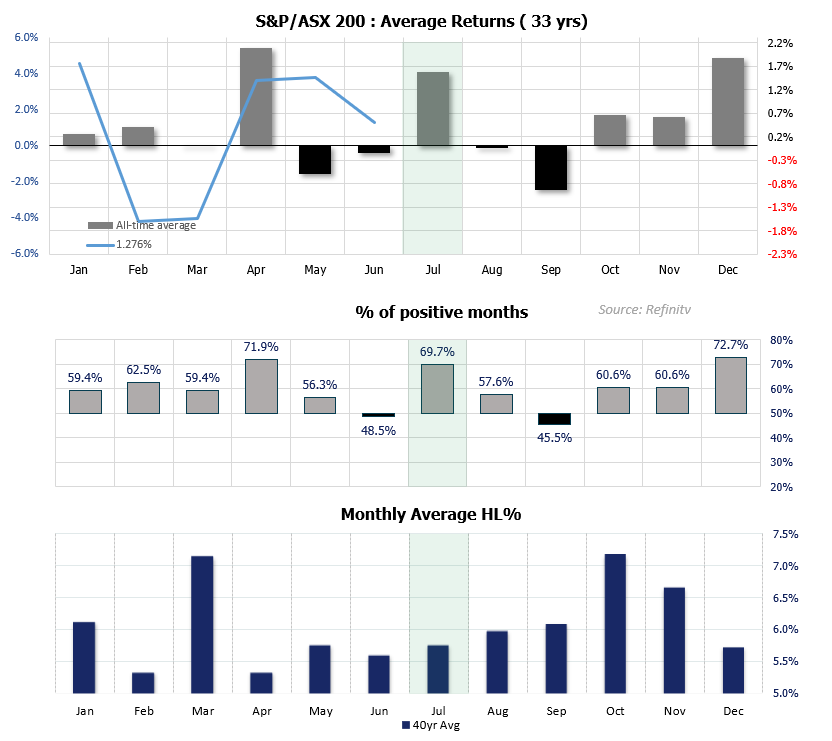
Chart prepared by Matt Simpson - Source: London Stock Exchange Group (LSEG), Australian Securities Exchange (ASX)
S&P ASX 200 Futures (SPI 200) Technical Analysis:
Wall Street futures were marginally higher overnight after President Trump walked back comments suggesting he might fire Federal Reserve Chair Jerome Powell. The Dow Jones futures—which tend to have the strongest correlation with the ASX 200—rose 0.4%, while the S&P 500 and Nasdaq 100 gained 0.2% and 0.1% respectively.
In response, SPI 200 futures are up 0.6% from yesterday’s low, suggesting a positive start for today’s ASX 200 cash market. However, prices are now trading around a notable resistance cluster that includes the December high (8,588), the February high (8,616), and the all-time high (8,636). This could limit further upside without a broader catalyst for risk-on sentiment.\
The 1-hour chart shows strong bullish momentum, but unless bulls are fuelled by fresh stock market optimism, sellers may look to fade into rallies toward these resistance zones. Initial downside targets include the high-volume node (HVN) at 8,536, followed by the 8,512 swing low and the 8,500 psychological handle. A break beneath these levels could signal the start of a deeper retracement.
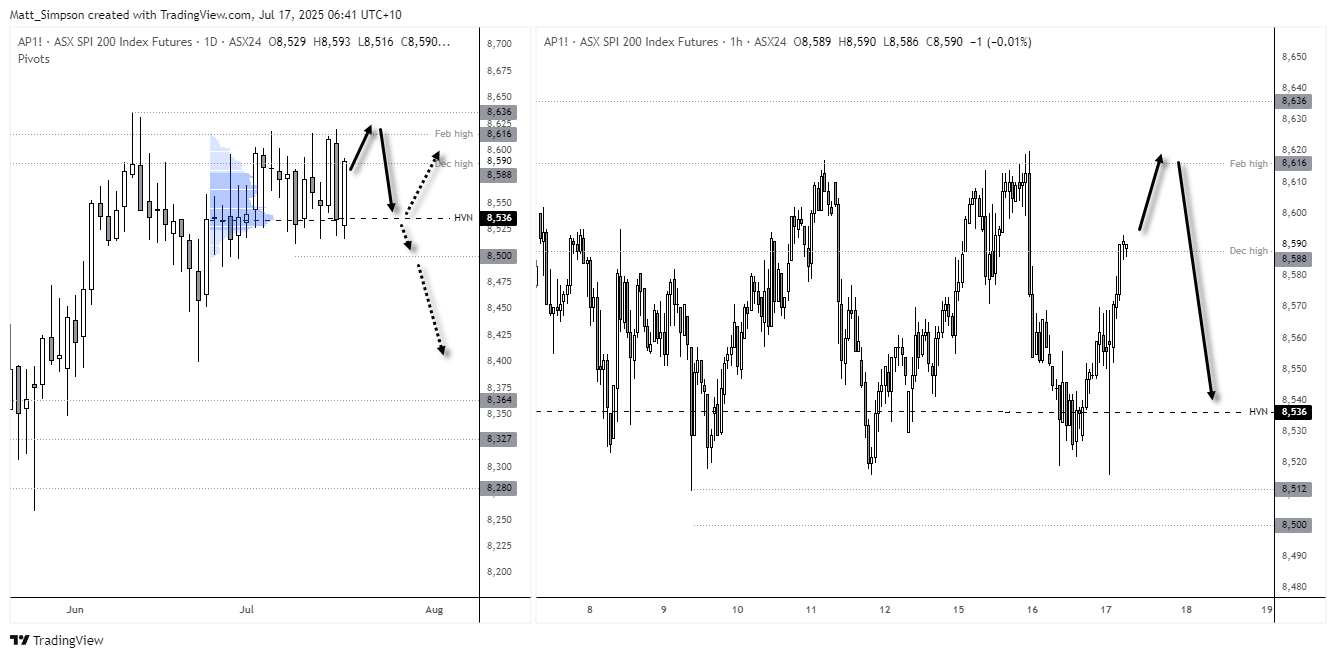
Chart analysis by Matt Simpson - Source: TradingView, ASX SPI 200 Index Futures
Economic Events in Focus (AEST / GMT+10)
08:45 NZD FPI (Jun) (NZD/USD, NZD/JPY, AUD/NZD)
09:50 JPY Trade Balance, Exports, Imports, Foreign Bonds & Stock Investment (Jun) (USD/JPY, AUD/JPY, EUR/JPY, Nikkei 225)
11:00 AUD MI Inflation Expectations (Jul) (AUD/USD, AUD/NZD, AUD/JPY, ASX 200)
11:30 AUD Employment Data, Unemployment Rate, NAB Quarterly Confidence (Jun) (AUD/USD, AUD/NZD, AUD/JPY, ASX 200)
16:00 GBP UK Employment, Wages, Unemployment Rate (May) (GBP/USD, GBP/JPY, GBP/CHF, EUR/GBP, FTSE 100)
16:00 CHF Trade Balance (Jun) (USD/CHF, CHF/JPY, EUR/CHF, GBP/CHF)
19:00 EUR CPI, Core CPI, HICP (Jun) (EUR/USD, DAX)
22:30 USD Jobless Claims, Retail Sales, Import/Export Prices, Philly Fed (Jun/Jul) (USD, S&P 500, Nasdaq 100, Dow Jones, Gold, Crude Oil)
22:30 CAD Foreign Securities Purchases (May) (USD/CAD, TSX)
00:00 USD Business Inventories, NAHB Housing Index, Retail Inventories (May/Jul) (USD, S&P 500)
00:00 USD FOMC Member Kugler Speaks (USD/JPY, EUR/USD, GBP/USD, AUD/USD, US indices)
00:30 USD Natural Gas Storage (Crude Oil, Natural Gas Futures)
02:45 USD FOMC Member Daly Speaks (USD/JPY, EUR/USD, GBP/USD, AUD/USD, US indices)
03:00 USD Atlanta Fed GDPNow (Q2) (USD, S&P 500, Gold, Crude oil)
View the full economic calendar
View the full economic calendar
-- Written by Matt Simpson
Follow Matt on Twitter @cLeverEdge
How to trade with City Index
You can trade with City Index by following these four easy steps:
- Open an account, or log in if you’re already a customer
• Open an account in the UK
• Open an account in Australia
• Open an account in Singapore
- Search for the market you want to trade in our award-winning platform
- Choose your position and size, and your stop and limit levels
- Place the trade
Latest market news




Open an account in minutes
Experience award-winning platforms with fast and secure execution, and enjoy tight spreads from 0.5 pts on FX and 0.3 pts on indices.
Economic calendar
Web Trader platform
Our sophisticated web-based platform is packed with features.
Related articles
Japanese Yen Short-term Outlook: USD/JPY Breakout Risk Builds Below 200-Day Average 10 13 2026
USD/JPY is trading in a narrow range beneath major resistance ahead of CPI, with the next breakout likely to set the near-term directional tone.

USD/JPY forecast: Dollar remains fundamentally supported ahead of CPI
The USD/JPY eased lower today with the greenback also declining against several other currencies. However, at the time of writing, oil prices were bouncing back and yields were off their lows again. The US dollar hadn’t moved much yet, but these forces could help it to regain its poise ahead of the release of US CPI on Wednesday.

British Pound Technical Outlook: GBP/USD Bulls Fight to Stabilize at Critical Support 10 13 2026
GBP/USD is compressing into a tight near-term range just above key support, with a breakout likely to provide the next directional cue.
This report is intended for general circulation only. It should not be construed as a recommendation, or an offer (or solicitation of an offer) to buy or sell any financial products. The information provided does not take into account your specific investment objectives, financial situation or particular needs. Before you act on any recommendation that may be contained in this report, independent advice ought to be sought from a financial adviser regarding the suitability of the investment product, taking into account your specific investment objectives, financial situation or particular needs.
StoneX Financial Pte. Ltd., may distribute reports produced by its respective foreign entities or affiliates within the StoneX group of companies or third parties pursuant to an arrangement under Regulation 32C of the Financial Advisers Regulations. Where the report is distributed to a person in Singapore who is not an accredited investor, expert investor or an institutional investor (as defined in the Securities Futures Act), StoneX Financial Pte. Ltd. accepts legal responsibility to such persons for the contents of the report only to the extent required by law. Singapore recipients should contact StoneX Financial Pte. Ltd. at 6826 9988 for matters arising from, or in connection with the report.
In the case of all other recipients of this report, to the extent permitted by applicable laws and regulations neither StoneX Financial Pte. Ltd. nor its associated companies will be responsible or liable for any loss or damage incurred arising out of, or in connection with, any use of the information contained in this report and all such liability is hereby expressly disclaimed. No representation or warranty is made, express or implied, that the content of this report is complete or accurate.
StoneX Financial Pte. Ltd. is not under any obligation to update this report.
Trading CFDs carries a high level of risk that may not be suitable for some investors. Consider your investment objectives, level of experience, financial resources, risk appetite and other relevant circumstances carefully. The possibility exists that you could lose some or all of your investments, including your initial deposits. If in doubt, please seek independent expert advice. Visit www.forex.com/en-sg/terms-and-policies for the complete Risk Disclosure Statement.