



AUD/USD Weekly Outlook: Aussie Slides as Oil Surges on Middle East Tensions
The Australian dollar breaks lower as crude oil rallies on rising geopolitical risk, while CPI and Powell’s testimony loom large.
Share this:

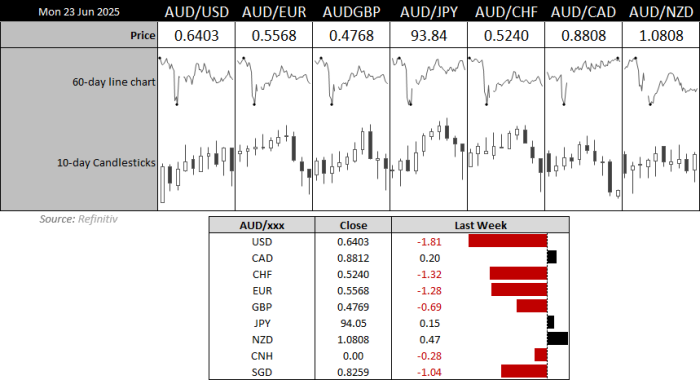
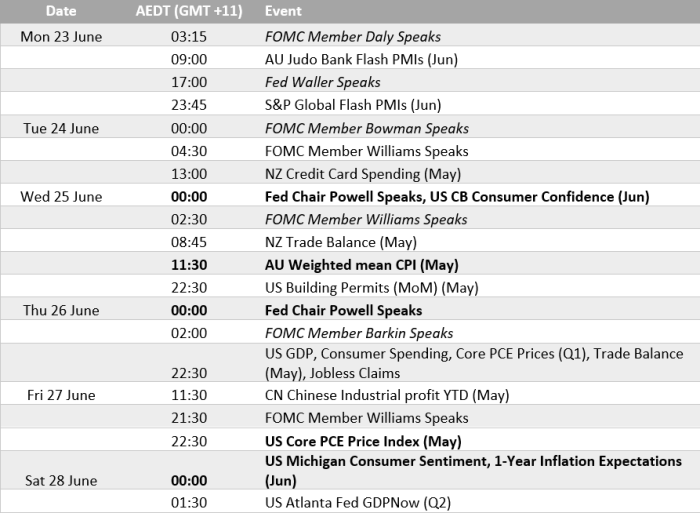
AUD/USD slid to a three-week low to start the week as crude oil prices soared following U.S. airstrikes on Iranian nuclear facilities. Rising geopolitical tensions have weighed heavily on risk appetite and increased safe-haven demand, dragging commodity currencies like the Australian dollar lower. With Australia’s monthly CPI due mid-week and Fed Chair Powell set to deliver testimony, markets are watching for signals on interest rate direction and global risk sentiment.
View related analysis:
- Australian Dollar Outlook: Will AUD/USD Follow NZD/USD Lower?
- AUD/USD, USD/CNH Outlook: US Dollar Hits Technical Juncture Ahead of FOMC
- Crude Oil Outlook: Strait of Hormuz Tensions Rise After U.S. Strikes Iran
- AUD/USD Weekly Forecast: Fed Decision and Australian Jobs Eyed
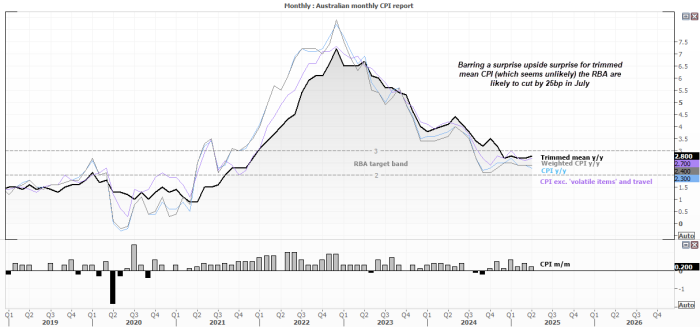
Australia’s Monthly CPI Report Could Cement an RBA Cut in July
Australia’s monthly inflation report is the last set of CPI figures to drop before the next RBA meeting. And unless we see a notable upside surprise, the RBA seem poised to cut by 25bp on July 8. While trimmed mean and weighed CPI ticked higher in April to 2.8% and 2.7% y/y respectively, they remain within the RBA’s 2-3% target band. Broad CPI slowed to a 4-year low of 2.3% y/y, and with soft growth and soft business sentiment to deal with, upside pressures to inflation seem far-fetched.
Employment figures from May were robust, though not on fire. And I suspect it is only a matter of time before we see the job market situation weaken (without crashing), which could justify at least one more 25bp cut in late Q3 or Q4. If for some reason the RBA opt to hold in July, August seems likely.
All Eyes on Powell’s Testimony After Cautious FOMC Outlook
Jerome Powell delivers his semi-annual monetary policy report testimony to the House Financial Services Committee late on Tuesday and Wednesday. Clearly this will gain a lot of attention, though it is debatable as to whether any surprises can be expected, arriving less than a week from the latest FOMC meeting. While Powell left the door open to a September cut, he also provided ample of wriggle room not to honour one. He also said it may “make a smart decision to wait a couple of months” before deciding on any change in policy. The Fed’s messaging was more focussed on the inflation side of things over the employment situation.
AUD/USD and NZD/USD: Tight Correlation Amid Middle East Risk-Off Sentiment
The recent bout of risk-off stemming from the Middle East has seen the correlation between AUD/USD and NZD/USD become very tight. They tend to track one another quite well regardless, though it is the New Zealand dollar which is taking the bigger hit so far this week, sending AUD/NZD higher after the open. But when you compare the daily charts of AUD/USD and NZD/USD, they are pretty much the same trade.
The usually inverted correlation between the US dollar and Australian dollar is all but gone, with the dollar index providing little clues as to how the Aussie will trade. But we know that a strong risk on oil surrounding the Israel-Iran conflict is a risk-off move for the Australian dollar and Wall Street.

US PCE Inflation in Focus — But Middle East Tensions May Overshadow It
Headlines form the Middle East could easily take the limelight away from any economic release this week, and that includes US GDO (which is a final release anyway) and the monthly core PCE print. However, if Iran bide their time and don’t escalate things further ahead of PCE inflation, a soft print could see odds of a July cut rise from ~58%.
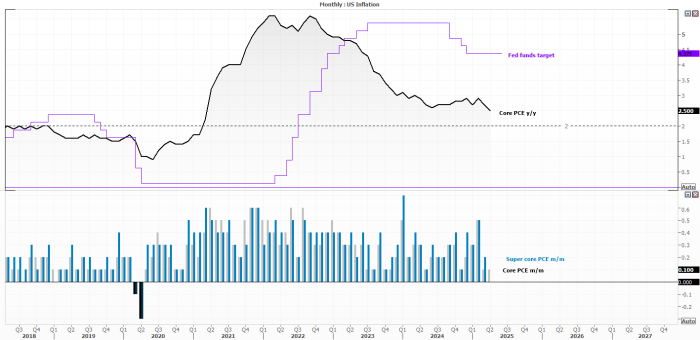
Core PCE slowed to a four-year low of 2.5%, and the closer it moves to that 2% target the better for dovish bets. And if we do somehow see a resolution between Iran and Israel, traders could refocus their attention on Fed policy with the growing expectations of a September cut.
AUD/USD Technical Analysis
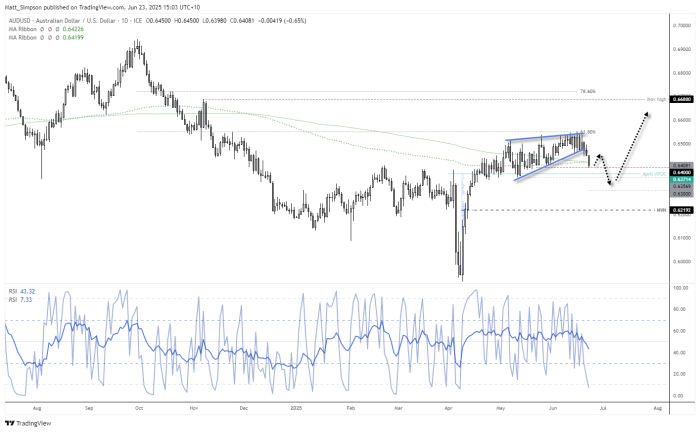
Bearish momentum has finally seen the downside break I have been touting for several weeks. A rising wedge pattern suggests a minimum downside target of 0.6370 (the wedge base), but with geopolitical tensions ratcheting up and momentum on my side, a move down to 63c could also be on the cards.
Note that prices are holding above 64c for now, and we could also see a near-term bounce back above the 200-day SMA and EMA before losses resume. But now AUD/USD has tipped its hand, traders could seek to fade into minor rallies to target the wedge low and 63c handle.
Further out, my bias is for AUD/USD to reach to new highs.



Open an account in minutes
Experience award-winning platforms with fast and secure execution, and enjoy tight spreads from 0.5 pts on FX and 0.3 pts on indices.
Economic calendar
Web Trader platform
Our sophisticated web-based platform is packed with features.
Related articles

USD/JPY Forecast: Is Rising Japanese Inflation Supporting the Yen?
As the trading week comes to an end, one of the most relevant developments in the FX market has been the renewed strength of the Japanese yen. This can be seen in the recent performance of USD/JPY, which has fallen nearly 1.0% over the last two trading sessions, highlighting a meaningful recovery in the Japanese currency against the U.S. dollar.


Australian Dollar Forecast: AUD/USD Support Reversal Sparks Monthly Range Breakout 10 23 2026
A sharp reversal off key support has fueled the AUD/USD recovery, with resistance now in focus ahead of next week’s Fed decision and Australian CPI.

Crude Oil Forecast: Weekend Iran Strike Fears Lift Oil Toward War Highs
Brent crude oil is accelerating above $110 as traders price in the risk of a US-Israeli strike on Iran over the weekend. How much more of a geopolitical premium can oil build in before the close?

This report is intended for general circulation only. It should not be construed as a recommendation, or an offer (or solicitation of an offer) to buy or sell any financial products. The information provided does not take into account your specific investment objectives, financial situation or particular needs. Before you act on any recommendation that may be contained in this report, independent advice ought to be sought from a financial adviser regarding the suitability of the investment product, taking into account your specific investment objectives, financial situation or particular needs.
StoneX Financial Pte. Ltd., may distribute reports produced by its respective foreign entities or affiliates within the StoneX group of companies or third parties pursuant to an arrangement under Regulation 32C of the Financial Advisers Regulations. Where the report is distributed to a person in Singapore who is not an accredited investor, expert investor or an institutional investor (as defined in the Securities Futures Act), StoneX Financial Pte. Ltd. accepts legal responsibility to such persons for the contents of the report only to the extent required by law. Singapore recipients should contact StoneX Financial Pte. Ltd. at 6826 9988 for matters arising from, or in connection with the report.
In the case of all other recipients of this report, to the extent permitted by applicable laws and regulations neither StoneX Financial Pte. Ltd. nor its associated companies will be responsible or liable for any loss or damage incurred arising out of, or in connection with, any use of the information contained in this report and all such liability is hereby expressly disclaimed. No representation or warranty is made, express or implied, that the content of this report is complete or accurate.
StoneX Financial Pte. Ltd. is not under any obligation to update this report.
Trading CFDs carries a high level of risk that may not be suitable for some investors. Consider your investment objectives, level of experience, financial resources, risk appetite and other relevant circumstances carefully. The possibility exists that you could lose some or all of your investments, including your initial deposits. If in doubt, please seek independent expert advice. Visit www.forex.com/en-sg/terms-and-policies for the complete Risk Disclosure Statement.