


Gold, USD/JPY Forecast: Two trades to watch
Gold falls to a yearly low ahead of FOMC minutes this week. USD/JPY hovers around 160 amid a stronger USD and weaker Japanese GDP.
Share this:


Gold falls to a yearly low ahead of FOMC minutes this week
Gold trades under pressure on Monday amid a stronger U.S. dollar and elevated Treasury yields, extending last week's 4.5% decline to a fresh 2026 low.
Markets are waiting for comments from Federal Reserve Chair Kevin Warsh today, together with the FOMC rate decision and the October meeting minutes on Wednesday.
The market is pricing in a 90% chance of a 25-basis-point hike in December and even a 10% chance of a 50-basis-point hike.
This follows hotter-than-expected inflation data last week, with core CPI rising 0.3%, while PPI data on Friday showed the annual rate climbing to 6.5% from 6.3%, marking the largest rise since November 2020.
Fed officials are also ramping up the pressure. Last week, Governor Christopher Waller brought the prospect of a 50-basis-point hike to the table, while Kansas City Fed President Jeff Schmid said inflation is still running too hot.
The U.S. dollar trades at a 19-month high, and Treasury yields are back above 5%, hurting demand for U.S. dollar-denominated, non-yielding gold.
Attention is on Warsh's tone and Wednesday's FOMC minutes to determine whether gold can stabilise at these levels. Hawkish commentary could send the precious metal lower.
Longer-term gold may struggle to gain any meaningful traction while the Federal Reserve is in a hiking cycle. It may need signs the Fed is ending the hiking cycle to seriously recover lost ground.
Gold forecast – technical analysis
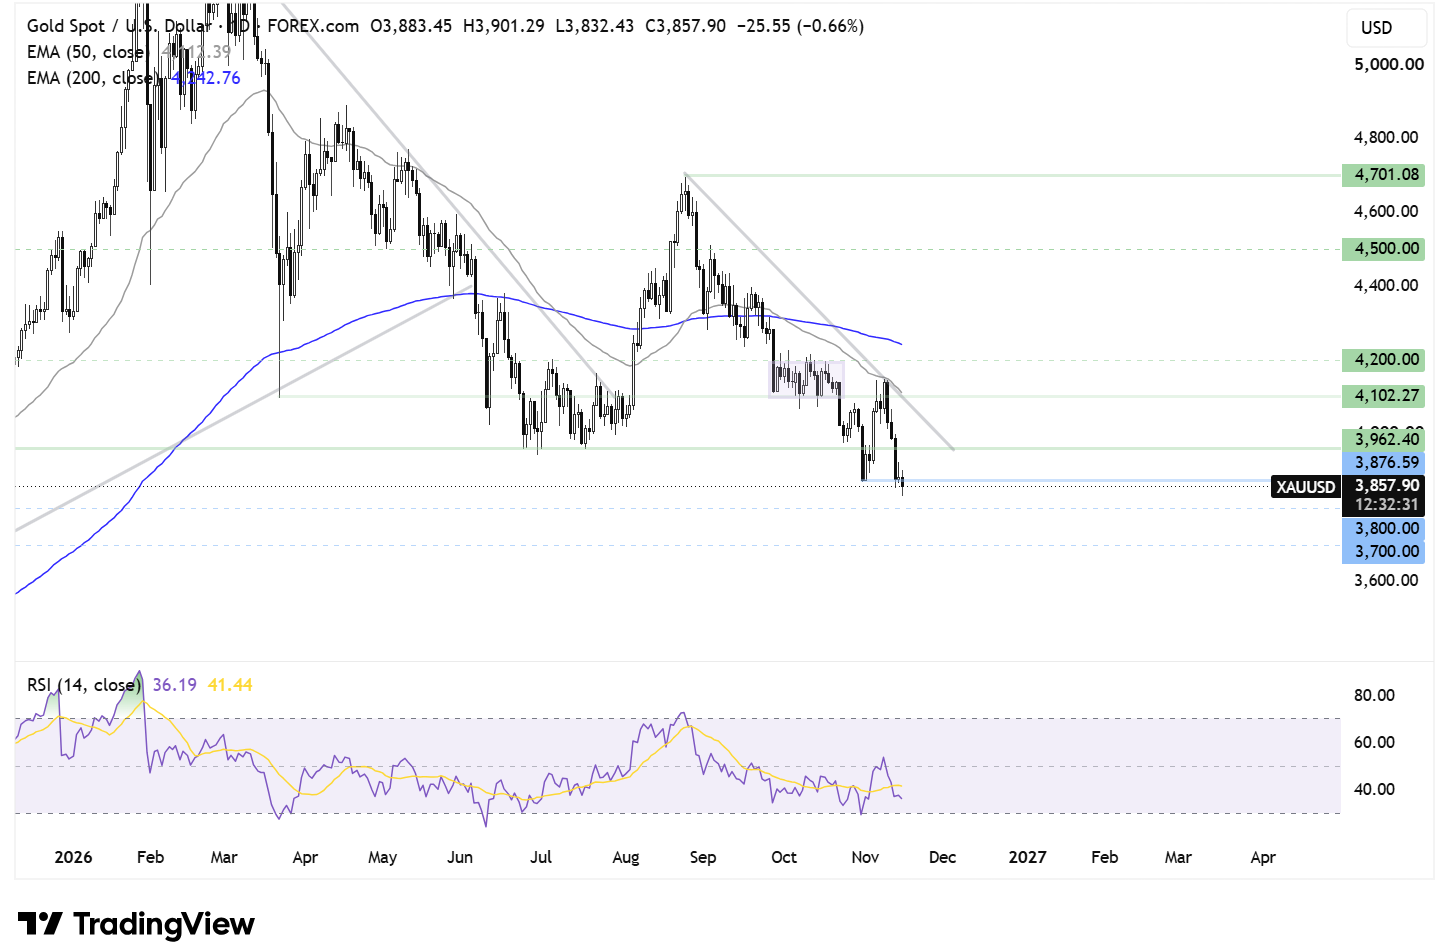
Gold trades below its 50 and 200 EMAs, as well as below its falling trend line, keeping the picture bearish. The RSI is also below 50, keeping sellers hopeful of further downside.
Sellers will look to break below the 2026 low reached today to extend the bearish move towards 3,800 and 3,700 as the next logical targets.
Any recovery would need to rise above the July low of 3,960, as well as the September low of 4,100. The 50 EMA sits above 4,200, while the 200 EMA at 4,250 would put the price on a firmer footing.
USD/JPY hovers around 160 despite amid USD strength and weaker Japanese GDP
USD/JPY is falling slightly as the yen sees marginal gains against the dollar, although the pair is recovering from session lows as downbeat Japanese GDP data cast doubt on the prospect of an immediate rate hike by the Bank of Japan.
Data shows that Japanese economic growth remained flat in Q3, disappointing investors who were expecting 0.1% growth after 0.4% growth in Q2. On an annualised basis, GDP contracted 0.1%, against expectations of 0.4% growth.
The data raises questions over the Bank of Japan's willingness to hike rates again in December, particularly after comments by BOJ official Asada, who warned that raising rates too quickly could weigh on growth and underlying inflation.
Meanwhile, the U.S. dollar continues its bullish bias, fuelled by hotter-than-expected CPI inflation data last week, PPI data and hawkish comments from Federal Reserve officials.
The market is fully pricing in a 25-basis-point hike in December, with a 10% chance of an outsized 50-basis-point hike.
Attention will be on Federal Reserve Chair Kevin Warsh's speech ahead of the FOMC minutes later this week. A hawkish Warsh could lift USD and Treasury yields further, driving the Fed-BoJ divergence.
This comes as the pair hovers around 160, a level that is considered a line in the sand for Japanese authorities to intervene.
USD/JPY forecast – technical analysis
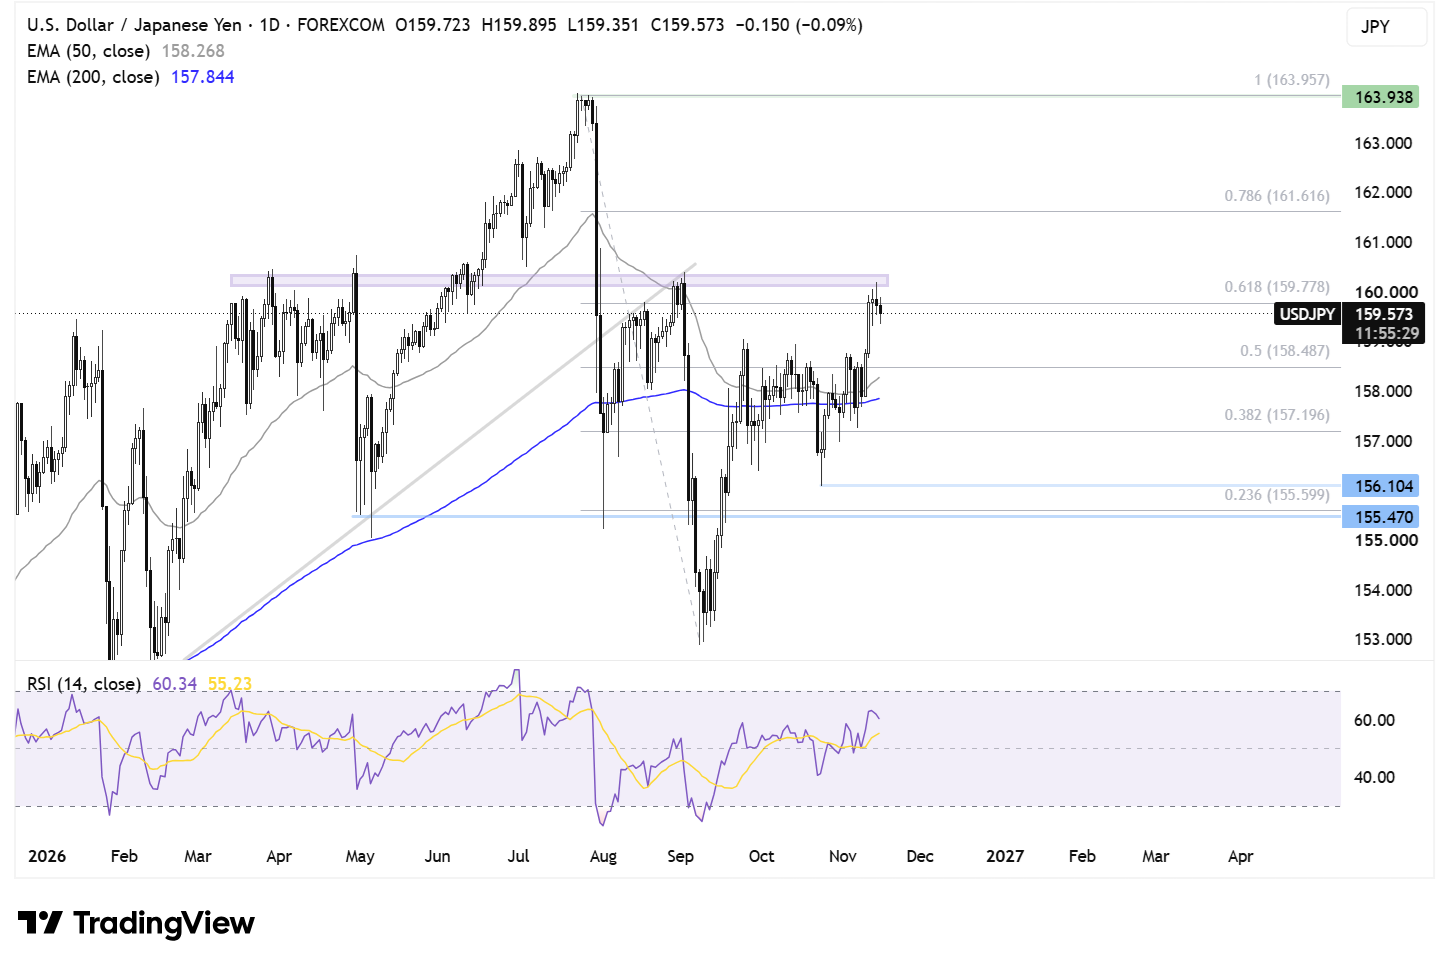
USD/JPY ran into resistance at the 160 level and has eased lower, trading at 159.55. The price remains above the 50 and 200 EMAs, and the RSI is above 50, keeping buyers hopeful of further upside.
Bulls would need to rise above the 160 resistance zone, a key level where Japanese authorities could potentially intervene. Above here, attention turns to 161.60, the 78.6% Fibonacci retracement of the move from the 164 high to the 153 low.
On the downside, support can be seen at 158.40, the 50% Fibonacci retracement, with a break below here exposing the 200 EMA at 157.80. A break below 157.20, the 38.2% Fibonacci level, would turn the outlook more bearish, bringing 156 into focus, followed by 155.50, the 23.6% Fibonacci level.
Related tags:



Open an account in minutes
Experience award-winning platforms with fast and secure execution, and enjoy tight spreads from 0.5 pts on FX and 0.3 pts on indices.
Economic calendar
Web Trader platform
Our sophisticated web-based platform is packed with features.
Related articles

Gold, USD/JPY Forecast: Two trades to watch 161126
Gold falls to a yearly low ahead of FOMC minutes this week. USD/JPY hovers around 160 amid a stronger USD and weaker Japanese GDP.

Gold Outlook: Asia Buys the Dip, US Hammers the Rip
Asia buys the dip, the US sells the rip. Hourly gold, dollar and Treasury yield data reveal a regional divide that has become especially pronounced since September.


USD/JPY Weekly Outlook: Bulls Eye Higher Range After Historic Rate Shock
A historic US rate shock has sent USD/JPY above 160, but with intervention risks rising and few major economic catalysts ahead, AI sentiment could hold the key to the next move.
This report is intended for general circulation only. It should not be construed as a recommendation, or an offer (or solicitation of an offer) to buy or sell any financial products. The information provided does not take into account your specific investment objectives, financial situation or particular needs. Before you act on any recommendation that may be contained in this report, independent advice ought to be sought from a financial adviser regarding the suitability of the investment product, taking into account your specific investment objectives, financial situation or particular needs.
StoneX Financial Pte. Ltd., may distribute reports produced by its respective foreign entities or affiliates within the StoneX group of companies or third parties pursuant to an arrangement under Regulation 32C of the Financial Advisers Regulations. Where the report is distributed to a person in Singapore who is not an accredited investor, expert investor or an institutional investor (as defined in the Securities Futures Act), StoneX Financial Pte. Ltd. accepts legal responsibility to such persons for the contents of the report only to the extent required by law. Singapore recipients should contact StoneX Financial Pte. Ltd. at 6826 9988 for matters arising from, or in connection with the report.
In the case of all other recipients of this report, to the extent permitted by applicable laws and regulations neither StoneX Financial Pte. Ltd. nor its associated companies will be responsible or liable for any loss or damage incurred arising out of, or in connection with, any use of the information contained in this report and all such liability is hereby expressly disclaimed. No representation or warranty is made, express or implied, that the content of this report is complete or accurate.
StoneX Financial Pte. Ltd. is not under any obligation to update this report.
Trading CFDs carries a high level of risk that may not be suitable for some investors. Consider your investment objectives, level of experience, financial resources, risk appetite and other relevant circumstances carefully. The possibility exists that you could lose some or all of your investments, including your initial deposits. If in doubt, please seek independent expert advice. Visit www.forex.com/en-sg/terms-and-policies for the complete Risk Disclosure Statement.