


Nikkei swings harder than Nasdaq as AI fears deepen
Nikkei 225 volatility is running well ahead of Nasdaq 100, with the index construction and Japan's heavy exposure to AI manufacturing potentially explaining the difference.
Share this:

- Nikkei 225 volatility roughly 30% above Nasdaq 100
- Daily return correlations exceed +0.90 across timeframes
- Japanese semiconductor stocks suffer heavy selling pressure
- Nvidia financing concerns add to downside risks
Concerns surrounding the AI sector aren't exclusively a US equity story, with swings in Japan's Nikkei 225 generally larger than those on the other side of the Pacific, even as the two markets have been moving almost in lockstep. Our analysis shows the Nikkei 225 has been consistently around 30% more volatile than the Nasdaq 100 across periods ranging from 10 to 60 sessions.
It's only a hunch, but I suspect part of the explanation lies in how the two indices are constructed, along with Japan's heavy exposure to upstream AI manufacturing, particularly semiconductor equipment. With investors questioning the enormous sums being poured into AI infrastructure, the Nikkei's price-weighted construction may be amplifying the swings.
Nikkei 225, Nasdaq 100 moving almost in lockstep
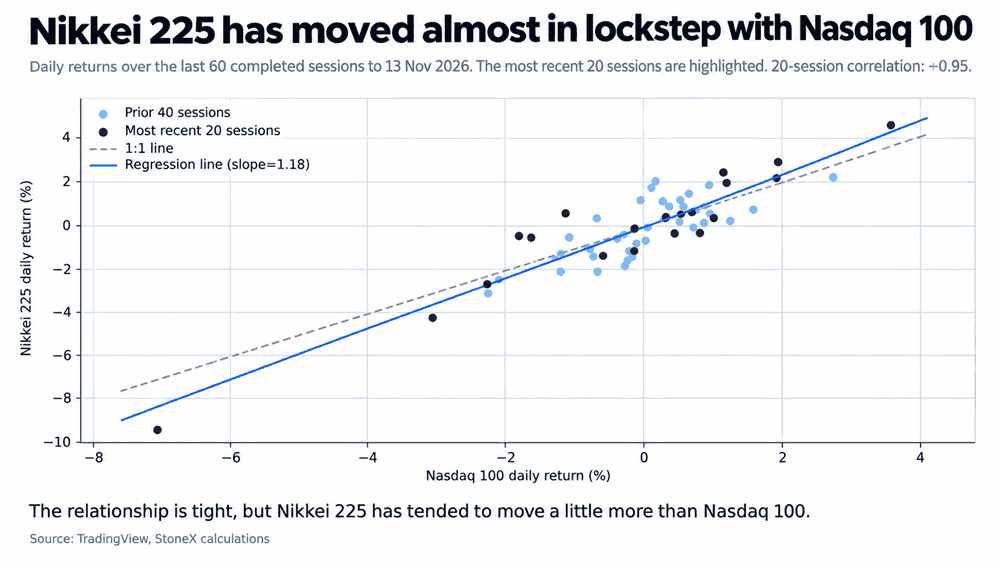
The graphic below shows just how closely the Nikkei 225 and Nasdaq 100 have been moving recently. Over the past 20 sessions, daily returns in our equivalent contracts have shown a correlation of +0.95, easing only slightly to +0.90 over 60 sessions. As the scatter plot shows, while the two markets have been moving almost in lockstep, it's the Nikkei that's tended to experience larger moves in either direction.
Source: TradingView
The enormous sell-off on 5 November followed Congress flipping blue in the US midterm elections, raising fears of tighter regulation of data centre construction and a potential slowdown in the AI infrastructure build-out.
While that decline has influenced the broader results, it's not the sole factor. Remove that session from the equation and the 20-session correlation remains strong at +0.89. That likely reflects the close link between Japan's upstream AI manufacturing suppliers and the US hyperscalers driving demand through their enormous infrastructure spending commitments.
Japan's volatility premium persists
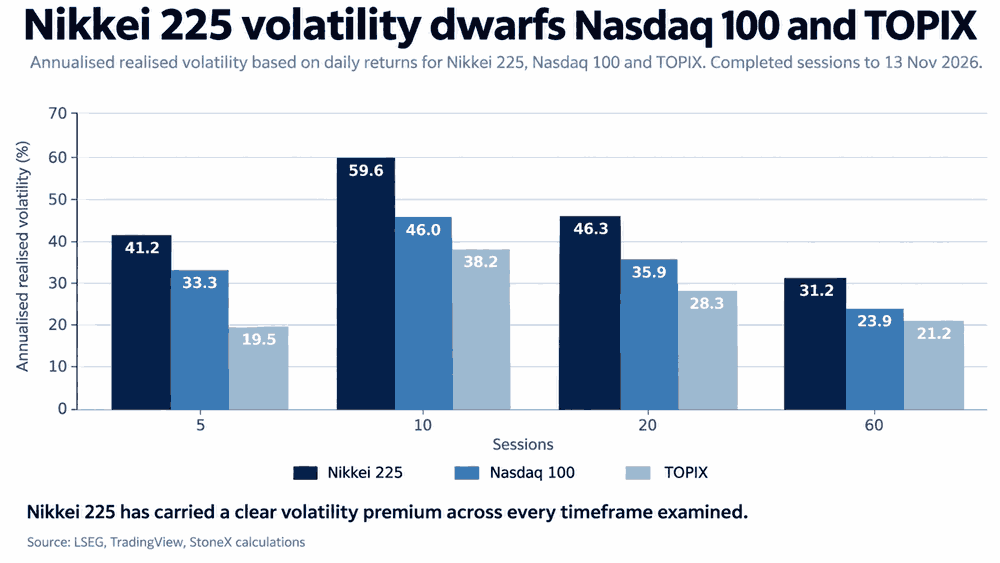
Reinforcing the more volatile nature of the Nikkei, the graphic below shows that over the past 10 sessions, annualised realised volatility in our Nikkei 225 contract has surged to 59.6%, compared with just 46.0% for the Nasdaq 100. The gap between the two is essentially maintained over longer windows, including 20 and 60 sessions, with the Nikkei experiencing roughly 30% more volatility across those periods.
Source: TradingView
Adding weight to the argument that AI-linked heavyweights are contributing to that difference is the comparison with Japan's broader TOPIX index. Over the past 20 sessions, its realised volatility stood at just 28.3%, compared with 46.3% for the Nikkei. While the TOPIX figure is based on the underlying cash index rather than our contract, the gap suggests the Nikkei's price-weighted construction and concentration in AI-linked companies may be contributing significantly to the larger swings.
Japan's semi stocks under the pump
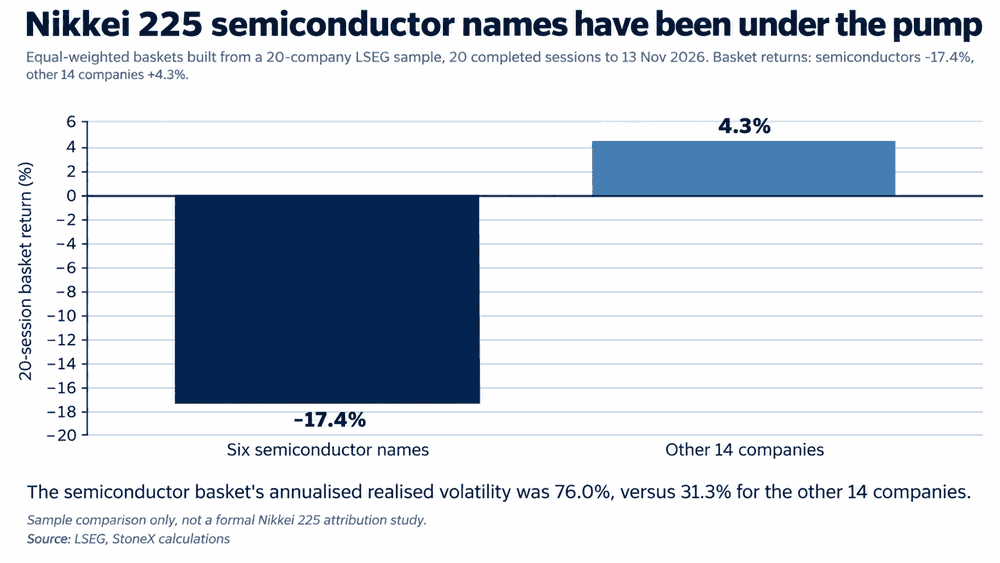
Further evidence comes from LSEG data showing an equal-weighted basket of six Japanese semiconductor names, Advantest, Tokyo Electron, Disco, Lasertec, Kioxia Holdings and Screen Holdings, slumped 17.4% over the 20 sessions to 13 November. The other 14 stocks in the sample rose 4.3%.
Source: LSEG
The volatility gap was even larger, with annualised realised volatility of 76.0% for the semiconductor basket versus just 31.3% for the remainder. While this doesn't measure the precise contribution to the Nikkei's performance, it adds weight to the argument that heavyweights such as Advantest and Tokyo Electron are acting to amplify the Nikkei's swings.
Nvidia's financing commitments face scrutiny
While everyone's hanging out for Nvidia's earnings on Tuesday and the Anthropic IPO slated for later this week, what could prove more influential is the analyst call with Nvidia's interim CEO, Colette Kress, following the results.
A report from the Wall Street Journal released earlier today suggests Nvidia was already reconsidering its financial backing of AI infrastructure projects before Jensen Huang's resignation last week, with Kress, the company's long-serving CFO, among those questioning the returns they were delivering. As such, what she says about future financing commitments could have significant implications for the broader AI build-out, including demand for upstream Japanese semiconductor equipment.
Nikkei 225 downside risks remain elevated
Source: TradingView
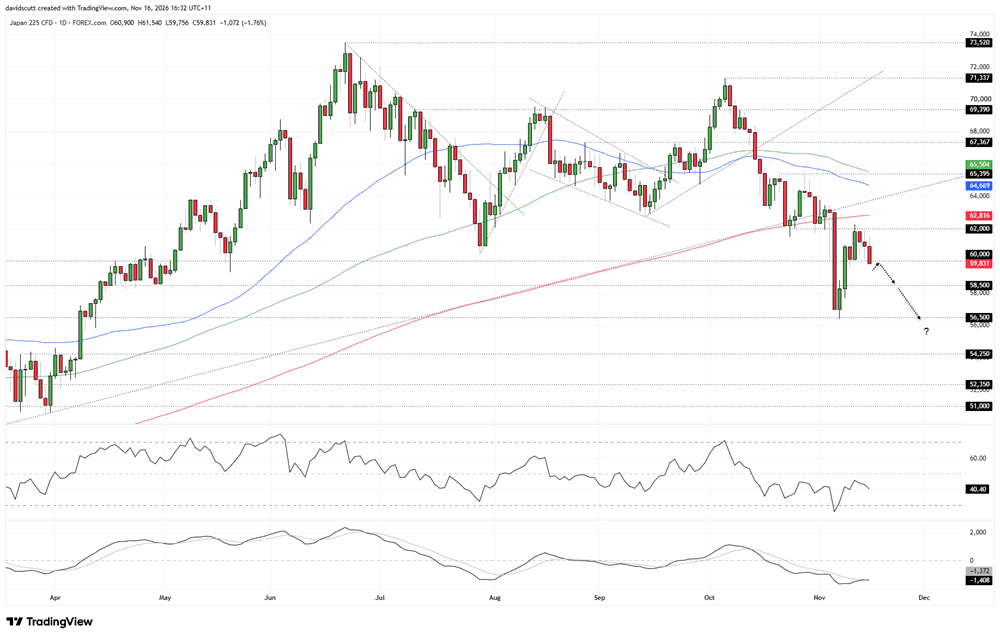
Our Nikkei 225 contract has slipped beneath 60,000 after spending several sessions trading in a sideways range capped by 62,000. Be it the string of lower highs, the loss of its 50, 100 and 200-day moving averages, or the break of uptrend support dating back to the Liberation Day lows of April 2025, the technical picture continues to favour selling rallies rather than buying dips.
That's especially the case given the price didn't even come close to retesting its 200-day moving average during the recent rebound, unlike the Nasdaq 100, which managed to reclaim that level before slipping back beneath it following Friday's sell-off and further weakness in futures during Asian trade today.
With the Nasdaq 100 sitting just beneath that important level, I'd be inclined to see how US equities respond later in the session before considering shorts in the Nikkei. Watching how the price reacts around 60,000 on shorter timeframes could be particularly useful, with a break that sticks, preferably followed by a backtest and rejection, strengthening the case for initiating shorts with a tight stop above 60,000 for protection. The initial target would be 58,500, followed by 56,500, where the price bottomed earlier this month.
Alternatively, should the price reclaim 60,000, it may encourage bulls to look for another bounce towards 62,000. Long setups could therefore be considered on a successful reclaim, with a tight stop beneath 60,000 for protection, targeting 62,000 initially. The 200-day moving average and former uptrend support would be other potential targets above that.
The oscillators continue to favour short setups over longs, although the message isn't definitive as yet. RSI (14) remains beneath the neutral 50 level but is yet to establish a fresh lower low, while MACD remains beneath its signal line in negative territory without showing a significant acceleration in downside momentum.
For now, the bearish bias remains, but with Nvidia earnings approaching, I wouldn't completely dismiss the possibility of another squeeze higher, particularly if US traders manage to ram the Nasdaq 100 back above its 200-day moving average and hold it there.


Open an account in minutes
Experience award-winning platforms with fast and secure execution, and enjoy tight spreads from 0.5 pts on FX and 0.3 pts on indices.
Economic calendar
Web Trader platform
Our sophisticated web-based platform is packed with features.
Related articles
Nikkei swings harder than Nasdaq as AI fears deepen
Nikkei 225 volatility is running well ahead of Nasdaq 100, with the index construction and Japan's heavy exposure to AI manufacturing potentially explaining the difference.

Forex & Gold Outlook: Dollar Dominates, Crosses Diverge
The US dollar rally gathers momentum as forex crosses develop contrasting technical setups. Matt Simpson examines eight FX markets and gold for potential trading opportunities.


Gold Outlook: Asia Buys the Dip, US Hammers the Rip
Asia buys the dip, the US sells the rip. Hourly gold, dollar and Treasury yield data reveal a regional divide that has become especially pronounced since September.
This report is intended for general circulation only. It should not be construed as a recommendation, or an offer (or solicitation of an offer) to buy or sell any financial products. The information provided does not take into account your specific investment objectives, financial situation or particular needs. Before you act on any recommendation that may be contained in this report, independent advice ought to be sought from a financial adviser regarding the suitability of the investment product, taking into account your specific investment objectives, financial situation or particular needs.
StoneX Financial Pte. Ltd., may distribute reports produced by its respective foreign entities or affiliates within the StoneX group of companies or third parties pursuant to an arrangement under Regulation 32C of the Financial Advisers Regulations. Where the report is distributed to a person in Singapore who is not an accredited investor, expert investor or an institutional investor (as defined in the Securities Futures Act), StoneX Financial Pte. Ltd. accepts legal responsibility to such persons for the contents of the report only to the extent required by law. Singapore recipients should contact StoneX Financial Pte. Ltd. at 6826 9988 for matters arising from, or in connection with the report.
In the case of all other recipients of this report, to the extent permitted by applicable laws and regulations neither StoneX Financial Pte. Ltd. nor its associated companies will be responsible or liable for any loss or damage incurred arising out of, or in connection with, any use of the information contained in this report and all such liability is hereby expressly disclaimed. No representation or warranty is made, express or implied, that the content of this report is complete or accurate.
StoneX Financial Pte. Ltd. is not under any obligation to update this report.
Trading CFDs carries a high level of risk that may not be suitable for some investors. Consider your investment objectives, level of experience, financial resources, risk appetite and other relevant circumstances carefully. The possibility exists that you could lose some or all of your investments, including your initial deposits. If in doubt, please seek independent expert advice. Visit www.forex.com/en-sg/terms-and-policies for the complete Risk Disclosure Statement.