



AUD/USD, ASX 200 Analysis: The Aussie remains buoyant ahead of Lowe, AU GDP
Share this:

Market summary
- The RBA delivered another 25bp hike (their 12th this cycle) to take their cash rate to 4.1%
- Whilst the RBA suspect that ‘inflation has passed its peak’ it remains ‘too high’ and some further tightening may be required
- AUD pairs were broadly higher, the Aussie was the strongest FX major, AUD/JPY closed to a fresh YTD high and the ASX 200 erased all of Mondays gains
- The Canadian dollar was given a lift following the RBA’s hike, as it slightly increases the odds of a BOC hike tonight or hawkish tone (they have paused the last two meetings and we suspect they will hold again today)
- Oil prices have done full circle, having filled Monday’s gap higher, pulled back towards $70 yesterday’s before rising back to Friday’s close (making it a directionless, tricky market to trade for now)
- Wall Street was slightly higher but volatility was low for the S&P 500, Nasdaq and Dow Jones
- Apple shares were a touch lower following Monday’s key reversal
- The world bank increased global growth forecasts for 2023 but downgraded them fore 2024


Events in focus (AEDT):
- 09:20 – Speech by Philip Lowe, Governor – A Narrow Path
- 09:50 - Panel Participation by Michele Bullock, Deputy Governor
- 11:30 – Australian GDP report
- 13:00 – China trade data
- 00:00 - BOC cash rate decision (hold expected)
ASX 200 at a glance:


- A bearish engulfing day formed due to the RBA hike
- 10 of its 11 sectors closed lower, led by consumer discretionary and industrial
- Intraday support: 7127, 7110.8, 7100 and 7077
- Intraday resistance: 7161.5, 7185.8
AUD/USD 1-hour chart:

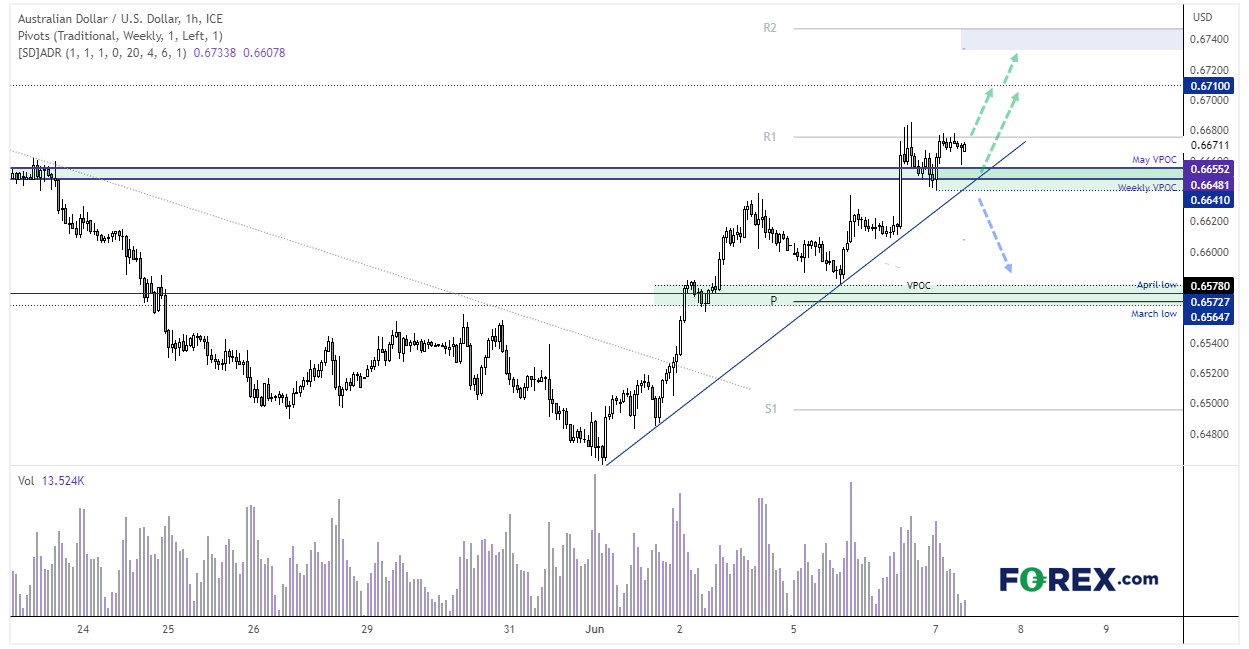
AUD/USD posted a strong rally immediately following the RBA’s hike, prices have since pulled back into the VPOC support zone and are now trying to break to a new cycle high. A bullish pinbar formed at the end of the NY close so perhaps it can break above the weekly R1 pivot and continue higher towards 0.6700 / 1.67100, and the upper ADR band near the weekly R2 pivot. A break beneath the bullish trendline assumes a retracement against the June rally is underway.
-- Written by Matt Simpson
Follow Matt on Twitter @cLeverEdge
How to trade with City Index
You can trade with City Index by following these four easy steps:
- Open an account, or log in if you’re already a customer
• Open an account in the UK
• Open an account in Australia
• Open an account in Singapore
- Search for the market you want to trade in our award-winning platform
- Choose your position and size, and your stop and limit levels
- Place the trade


Open an account in minutes
Experience award-winning platforms with fast and secure execution, and enjoy tight spreads from 0.5 pts on FX and 0.3 pts on indices.
Economic calendar
Web Trader platform
Our sophisticated web-based platform is packed with features.
Related articles
USD/CAD shooting star puts September surge on notice
USD/CAD has printed a clear bearish reversal pattern after an extraordinary September surge, but confirmation may depend heavily on how US Treasury yields react to Friday’s payrolls report.

USD/CHF Reverses as Swiss Franc Surges amid Bond Carnage
USD/CHF reverses from channel resistance as bond volatility surges and broad Swiss franc strength points to a possible carry-trade unwind.

USD/MXN Analysis: Is Super Peso Starting to Fade?
Over recent trading sessions, the Mexican peso has continued to show signs of weakness against the U.S. dollar. This can already be seen in USD/MXN, which has gained more than 1.7% over the last three sessions, highlighting sustained buying pressure in favor of the dollar in the short term.

This report is intended for general circulation only. It should not be construed as a recommendation, or an offer (or solicitation of an offer) to buy or sell any financial products. The information provided does not take into account your specific investment objectives, financial situation or particular needs. Before you act on any recommendation that may be contained in this report, independent advice ought to be sought from a financial adviser regarding the suitability of the investment product, taking into account your specific investment objectives, financial situation or particular needs.
StoneX Financial Pte. Ltd., may distribute reports produced by its respective foreign entities or affiliates within the StoneX group of companies or third parties pursuant to an arrangement under Regulation 32C of the Financial Advisers Regulations. Where the report is distributed to a person in Singapore who is not an accredited investor, expert investor or an institutional investor (as defined in the Securities Futures Act), StoneX Financial Pte. Ltd. accepts legal responsibility to such persons for the contents of the report only to the extent required by law. Singapore recipients should contact StoneX Financial Pte. Ltd. at 6826 9988 for matters arising from, or in connection with the report.
In the case of all other recipients of this report, to the extent permitted by applicable laws and regulations neither StoneX Financial Pte. Ltd. nor its associated companies will be responsible or liable for any loss or damage incurred arising out of, or in connection with, any use of the information contained in this report and all such liability is hereby expressly disclaimed. No representation or warranty is made, express or implied, that the content of this report is complete or accurate.
StoneX Financial Pte. Ltd. is not under any obligation to update this report.
Trading CFDs carries a high level of risk that may not be suitable for some investors. Consider your investment objectives, level of experience, financial resources, risk appetite and other relevant circumstances carefully. The possibility exists that you could lose some or all of your investments, including your initial deposits. If in doubt, please seek independent expert advice. Visit www.forex.com/en-sg/terms-and-policies for the complete Risk Disclosure Statement.